The Random Forest method identified 148 square kilometres of bamboo and achieved an overall accuracy of 85 percent, while SNIC mapped 132 square kilometres with an overall accuracy of 68.9 percent.
The study, published in Discover Forests, was carried out by researchers including Kabir Uddin, Sajana Maharjan, Erica Udas and Ananda Khadka.
Bamboo is no minor player in Nepal’s landscapes and economy. Rural communities depend on it for building materials, furniture, traditional tools and handicrafts. In mountainous country, it also stabilises slopes, helps prevent landslides and maintains soil health. Ecologically, bamboo contributes to biodiversity conservation, soil stabilisation and carbon sequestration, and its fast growth and natural regeneration make it a valuable alternative to wood, easing pressure on forests. Globally, demand for bamboo in construction, furniture, handicrafts and industrial applications is rising, which makes accurate distribution information essential for resource management, conservation planning and policy. Traditional field surveys, meanwhile, are labour-intensive, expensive and difficult to scale across large regions.
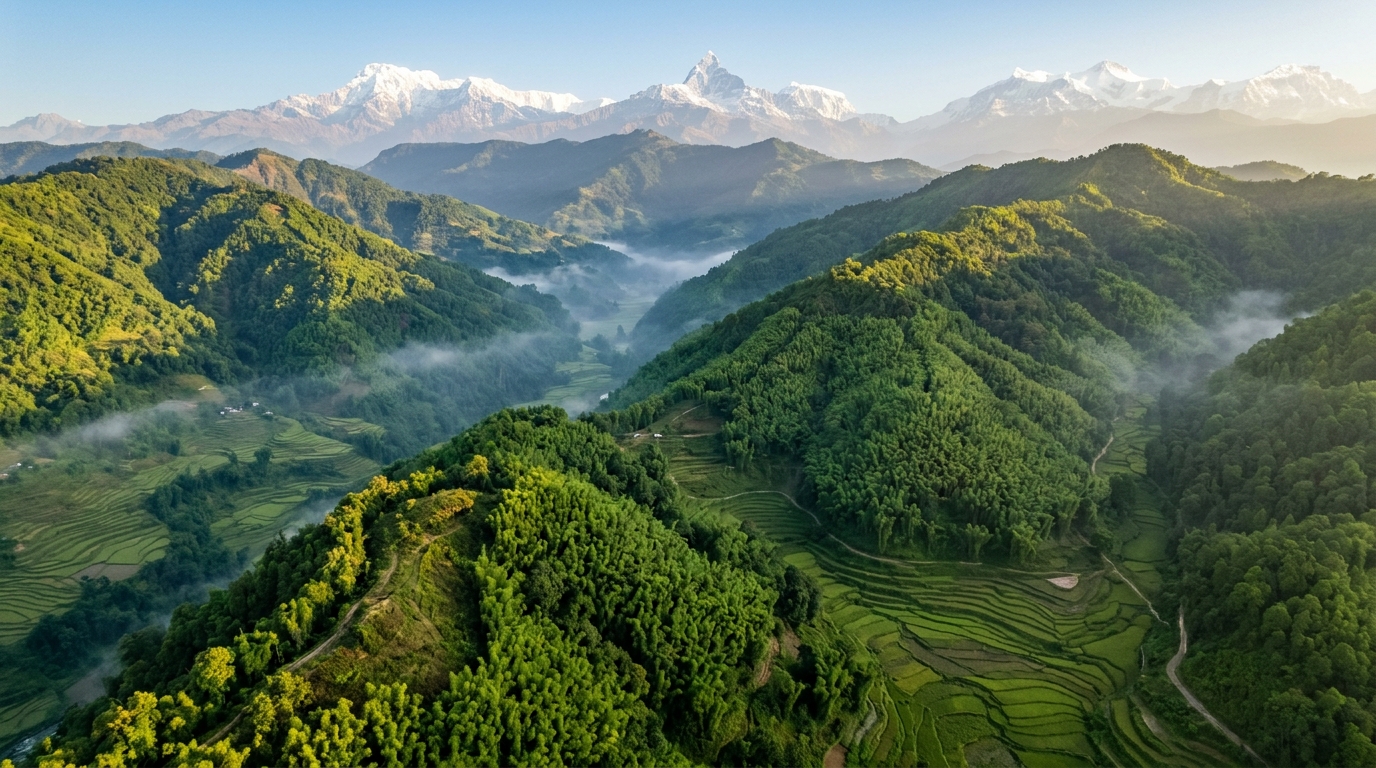
The researchers focused on the districts of Khotang, Bhojpur, Dhankuta, Terhathum, Panchthar, Ilam and Udayapur, a landscape whose topography ranges from 86 metres to 4,632 metres in elevation. That vertical span produces a corresponding range of vegetation, from subtropical forests in the lowlands to temperate forests in the mid-hills and alpine vegetation at high elevation. Mapping bamboo in such terrain is genuinely difficult. Bamboo can share spectral characteristics with mixed woods and shrubs in satellite imagery, making the two hard to tell apart, and mountainous topography adds a further layer of complexity to the classification process.
To overcome those obstacles, the team built its analysis around Sentinel-2 surface reflectance imagery at 10-metre resolution, freely available and processed entirely in Google Earth Engine. They constructed a cloud-free annual composite for 2023, covering January 1 to December 31, by loading the Sentinel-2 surface reflectance dataset together with a cloud probability dataset and applying cloud masking with probability thresholds. Two median composites, generated using 15 percent and 80 percent cloud probability thresholds, were mosaicked to improve cloud-free coverage. The final composite was visualised with near-infrared, red and green bands and exported as a 10-metre-resolution asset clipped to the study area.
A backend script generated 48 variables from the composite: 26 normalised difference variables designed to highlight differences between spectral bands and separate vegetation from built-up areas, bare ground and water; five spectral bands capturing information on plant health, canopy structure and vegetative vigour; and core vegetation indices including NDVI, EVI, SAVI and the red-edge NDVI. Urban and soil indices such as NDBI, BSI and IBI helped identify impervious surfaces, while NDWI, NDMI and AWEI improved the analysis of water bodies and moisture. Three terrain covariates, elevation, slope and aspect, were derived from the SRTM digital elevation model, reflecting their influence on vegetation distribution. The Random Forest model was trained on 5,976 labelled samples, with bamboo assigned a value of 1 and all other land cover a value of 0. Training samples were collected through visual analysis of high-quality time-series imagery in Google Earth, and independent validation samples were separated from the training dataset. Participatory field verification using the QField mobile application during field visits, along with local community consultations, strengthened validation reliability.
They argue that Random Forest’s inherent robustness to correlated predictors, because each tree is built from a random subset of variables, limits multicollinearity’s influence on overall classification performance, though it may affect variable importance estimates. Future studies, they suggest, could apply correlation analysis or feature selection methods such as a Pearson correlation threshold, variance inflation factor, recursive feature elimination or Boruta to reduce redundancy and improve interpretability.
The SNIC pathway took a different route. Object-based image segmentation groups spectrally similar pixels into meaningful segments, reducing spectral noise. The team set a compactness value of 12 and a neighbourhood size of 32 to preserve object shape and local spatial context, then computed mean spectral values and vegetation indices for each segment before classifying the segmented objects with the Random Forest classifier. After training, the model produced a bamboo probability layer, and the researchers applied a strict probability cutoff of 0.95, selected after visually comparing multiple threshold outputs against high-resolution reference imagery to minimise false positives. Post-processing removed non-vegetated areas using a vegetation mask set at NDVI greater than 0.3, and a 3 by 3 focal mode filter reduced pixel-level noise.
The results exposed meaningful differences between the two approaches. Udayapur showed the largest bamboo extent under both methods, at 38 square kilometres by SNIC and 34 by RF. Khotang and Panchthar also held substantial bamboo areas, particularly in the SNIC results, with 32 and 26 square kilometres respectively. Terhathum recorded the smallest extent under both techniques, at 2 square kilometres by SNIC and 6 by RF. Overall, Random Forest produced slightly higher area estimates, suggesting it was more sensitive in identifying bamboo pixels, whereas SNIC classified bamboo patches more conservatively.
The study’s authors are candid about its limitations. Training data derived primarily from visual interpretation of high-resolution imagery may introduce subjective bias, especially in heterogeneous vegetation where different species can look spectrally alike. The use of a single annual composite did not fully account for seasonal or phenological variability in bamboo, which may influence spectral separability, and explicit topographic correction was not fully applied. SNIC results proved sensitive to parameter settings such as compactness and neighbourhood size, which may need adjustment in different landscapes. Limited availability of field-based reference samples remains a major constraint on accuracy and generalisation across diverse ecological settings. Future work, the researchers recommend, should incorporate multi-seasonal or multi-temporal imagery, radar or hyperspectral datasets, LiDAR or drone-based imagery, well-distributed ground-truth sampling across topographic and ecological zones, GPS-supported surveys, and collaboration with local forestry departments and bamboo sector stakeholders.
Subject of Research: Satellite-based mapping of bamboo distribution in eastern Nepal comparing Random Forest and SNIC classification of Sentinel-2 imagery
Article Title: Mapping bamboo distribution in Eastern Nepal using random forest and SNIC classification with sentinel 2 imagery
Article References: Uddin, K., Maharjan, S., Udas, E., & Khadka, A. (2026). Mapping bamboo distribution in Eastern Nepal using random forest and SNIC classification with sentinel 2 imagery. Discover Forests, 2(1), Article 85. https://doi.org/10.1007/s44415-026-00144-2
Image Credits: AI Generated
DOI: 10.1007/s44415-026-00144-2
Keywords: bamboo, Nepal, remote sensing, Sentinel-2, Random Forest, SNIC, Google Earth Engine, classification accuracy, forest mapping, Koshi Province, vegetation indices, GIS
News Source: Alan Morgan. (November 5, 2026). Random Forest Outperforms Clustering to Map Nepal’s Bamboo from Space. Scienmag.