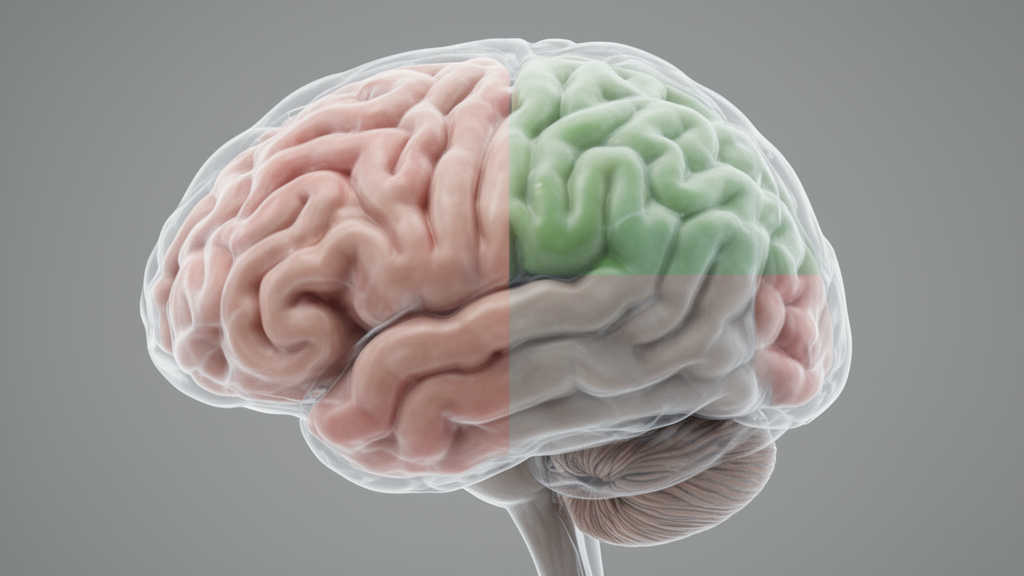
A computational analysis combining continuous disease staging with data-driven clustering has identified four distinct trajectories of longitudinal brain atrophy in Alzheimer’s disease.
To capture disease trajectories more effectively than earlier models, researchers developed an analytical framework that primarily positions subjects on a continuous latent-time disease scale. Following this continuous staging step, the algorithm groups longitudinal patterns of brain loss using a completely data-driven clustering process. At the core of the framework is a series of non-linear mixed-effects models integrating cluster-specific fixed effects alongside subject-specific random effects.
The investigative team applied the algorithm to longitudinal structural magnetic resonance imaging scans obtained from the Alzheimer’s Disease Neuroimaging Initiative and Open Access Series of Imaging Studies databases. The resulting cluster configurations underwent detailed evaluation by examining associated biomarkers, evidence of co-pathologies, and overlap with previously described Alzheimer’s disease subtypes.
Within the primary datasets, the algorithm revealed four characteristic longitudinal atrophy trajectories: progressive atrophy, slow progression, delayed atrophy, and high atrophy. The high atrophy pattern presented the greatest extent of structural loss, concentrating heavily in brain regions typically affected in standard Alzheimer’s disease pathology. In contrast, the slow progression group exhibited the mildest structural degradation across the evaluated disease timeline.
The delayed atrophy group demonstrated relative structural preservation throughout earlier disease phases, followed by rapid and pronounced neurodegeneration during late-stage disease. Meanwhile, the progressive atrophy group followed an atrophy trajectory corresponding to standard, continuous Alzheimer’s disease progression across time.
To evaluate the stability and generalizability of the identified trajectories, the researchers tested the algorithm against perturbations of the discovery cohort and analyzed an independent validation dataset from the BioFINDER-2 cohort. The original four clusters were only somewhat reproduced under discovery cohort perturbations. In the independent BioFINDER-2 cohort, the algorithm identified two clusters that reflected certain structural characteristics of the clusters found in the discovery datasets.
The authors concluded that while the integrated modeling pipeline addresses key limitations of prior attempts to map atrophy, the identified groupings appear to represent mixes of established subtypes derived from continuous progression rather than wholly discrete clinical subtypes.
In detailing the clinical relevance of their findings, the researchers observed that the four identified atrophy clusters expressed distinct clinical profiles across different disease stages. Establishing a clearer scientific understanding of this heterogeneous disease progression remains essential, as improved characterization is directly needed to enable early detection and targeted treatment of Alzheimer’s disease.
Subject of Research: Data-driven modeling of longitudinal brain atrophy trajectories in Alzheimer’s disease
Article Title: Data-driven clustering of atrophy patterns in Alzheimer’s disease
Article References: Winzell, F., Raket, L. L., Overgaard, N. C., Åström, K., Stomrud, E., Spotorno, N., Janelidze, S., Palmqvist, S., Heyden, A., Arvidsson, I., & Mattsson-Carlgren, N. (2026). Data-driven clustering of atrophy patterns in Alzheimer’s disease. Alzheimer's Research & Therapy. https://doi.org/10.1186/s13195-026-02261-8
Image Credits: AI Generated
DOI: 10.1186/s13195-026-02261-8
Keywords: Alzheimer's disease, brain atrophy, longitudinal MRI, data-driven clustering, continuous disease staging, neuroimaging, disease progression, ADNI, OASIS database, BioFINDER-2, neurodegeneration, latent-time modeling, non-linear mixed-effects models, structural biomarkers, co-pathology, disease subtypes
News Source: Cassandra Pierce. (November 19, 2026). Data-Driven Modeling Identifies Four Distinct Alzheimer’s Disease Brain Atrophy Patterns. Scienmag.