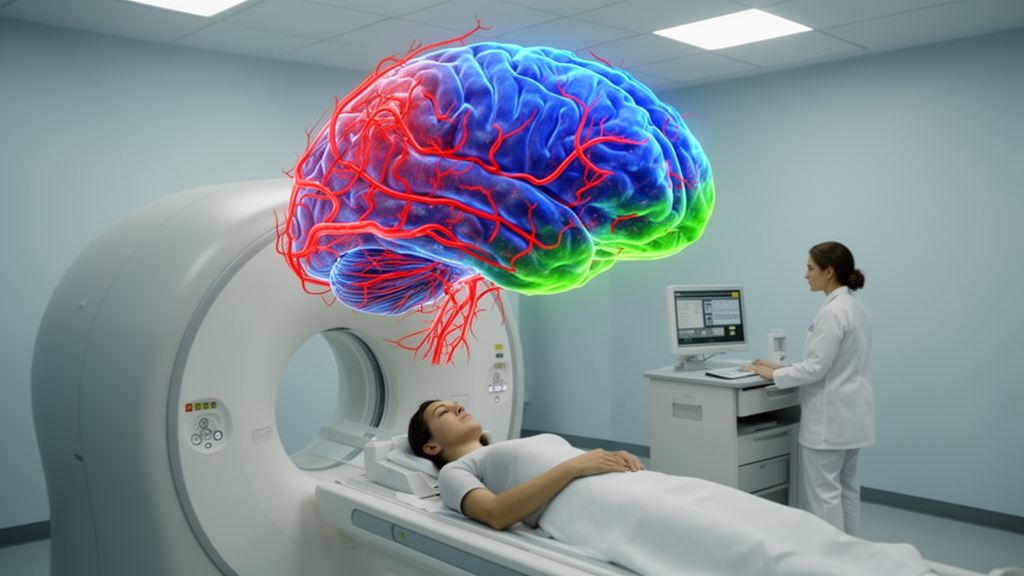
Ultra-high-resolution MRI has revealed a close match between the distribution of blood flow and the concentration of cell bodies across the layered human cerebral cortex, according to a study by researchers at the University of Southern California. The team combined seven-tesla imaging of 30 healthy adults with the BigBrain digital reconstruction, a detailed atlas of cellular anatomy, to create a new noninvasive index called the cerebral blood flow–cell body staining intensity similarity index, or CCSI. The score quantifies how closely perfusion follows cellular density from the outer surface of the cortex to its deeper layers. Higher CCSI values indicated regions where cell-rich layers also tended to receive more blood. The findings were published in Nature Communications.
“The brain has almost no ability to store energy, so its cells depend on a constant and carefully regulated supply from the bloodstream,” said Fanhua Guo, co-first author of the study and a researcher at USC’s Mark and Mary Stevens Neuroimaging and Informatics Institute. “Our new measure gives us a way to study how well that energy supply is positioned to meet cellular demands in different parts of the cortex.” The result offers a spatial measure rather than a simple record of how much blood reaches a region. It asks whether that supply is distributed in a pattern that corresponds to where the cortex’s cells are located.
To map perfusion, the researchers used arterial spin labeling, or ASL, an MRI technique that magnetically labels water in blood and follows it into brain tissue. A seven-tesla scanner produced images at a spatial resolution of one cubic millimeter, allowing the team to evaluate blood flow at multiple depths through the cortex. The study enrolled 30 healthy adults, and 14 returned for a second scan to assess the repeatability of the measurements. The cortex was divided into 360 regions. Researchers then compared the laminar blood-flow profiles with cell-body staining intensity recorded in BigBrain, a high-resolution three-dimensional reconstruction of a human brain.
This layer-by-layer approach addresses a limitation of conventional imaging, which often averages signals across the full thickness of the cortex. The cortex is not uniform: it contains layers with different proportions and types of neurons and supporting cells. “By imaging blood flow at very high resolution, we can begin to see how perfusion changes from the outer surface of the cortex to its deeper layers,” said Chenyang Zhao, the other co-first author and a researcher at the Stevens INI. In most cortical regions, blood flow and cellular organization followed similar patterns, although the strength of their alignment varied across the brain. It was strongest in primary visual and sensorimotor areas involved in vision, movement and touch.
The researchers next tested what CCSI might represent biologically by comparing it with maps of mitochondrial activity, cell types and gene expression. Regions with stronger coupling between perfusion and cellular density also showed greater mitochondrial respiratory capacity, the maximum rate at which mitochondria can produce usable energy. This was an association, not evidence that matching blood flow and cell distribution causes greater energy production. Importantly, total blood flow did not show the same relationship with mitochondrial capacity. The authors therefore argue that CCSI may capture metabolic organization that a conventional regional blood-flow measurement can miss.
“Blood flow tells us how much blood reaches a region, but it does not tell us how that supply is distributed in relation to the cells that need it,” said Danny JJ Wang, senior and corresponding author, professor of neurology, and director of imaging technology innovation at the Stevens INI. “CCSI adds that missing spatial information and may provide a more biologically meaningful picture of how vascular supply supports energy use across cortical layers.” The distinction is central to the new measure: a similar average flow level can conceal very different arrangements of vessels and cells across the layers of a cortical region.
Molecular comparisons added further context. Higher CCSI values were associated with capillary endothelial cells, which line the smallest blood vessels and help regulate delivery of blood to surrounding tissue. The index was also associated with mature oligodendrocytes, the glial cells that produce myelin, a protective coating around nerve fibers. Because oligodendrocytes also support nerve-fiber metabolism, their association with CCSI suggests a possible link between vascular supply, cellular support and neuronal energy requirements. Gene-expression patterns linked to CCSI likewise involved energy metabolism, blood-vessel development, vascular organization and healthy mitochondria. These convergent associations support the interpretation that perfusion and cellular architecture reflect a coordinated system, rather than two unrelated maps.
CCSI also improved estimates of what the cortex does. The team used structural-functional coupling analysis, a method that predicts functional properties from features of cortical structure, to test whether adding the new measure increased model accuracy. Adding CCSI significantly improved predictions in higher-order association regions, where the relationship between structure and function is generally less direct than in sensory and motor areas. These regions support functions such as memory, reasoning and attention. The result suggests that vascular and metabolic organization may explain aspects of brain function that cellular structure alone cannot capture, although the analysis does not establish a causal pathway.
Several limitations constrain the conclusions. The molecular and cellular comparisons depended on reference atlases generated from a limited number of postmortem donors, so the living-brain perfusion maps and the anatomical reference data did not come from the same individuals. CCSI currently measures patterns across groups rather than at the level of a single person. The study also established correlation rather than causation: it cannot show that stronger blood-flow alignment causes more efficient energy use, or that disrupting the relationship produces neurological disease. Larger and more diverse samples, repeat measurements and studies of aging and neurological or psychiatric conditions will be needed to evaluate its clinical potential.
Those limitations leave CCSI as a research framework rather than a diagnostic test. Disruptions involving blood flow, metabolism and oligodendrocyte function occur in conditions including Alzheimer’s disease, multiple sclerosis, schizophrenia and epilepsy, and the new index could eventually help researchers examine how vascular supply becomes separated from cellular organization in those disorders. “Understanding the healthy relationship between vascular supply and cellular organization is an important first step,” said Neda Jahanshad, professor of neurology and biomedical engineering at the Stevens INI. The long-term goal is to determine whether changes in this relationship can reveal early signs of disease or help evaluate treatments aimed at restoring brain metabolism and vascular health. For now, the study’s central achievement is a measurable bridge between millimeters-scale blood flow, cortical cellular architecture and the cellular machinery of energy production.
Subject of Research: Noninvasive MRI measurement of blood-flow alignment with cellular energy organization across the human cerebral cortex
Article Title: New brain imaging measure reveals how closely blood flow matches brain cells’ energy needs
Article References: New brain imaging measure reveals how closely blood flow matches brain cells’ energy needs. Original publication (Bibliographic details unavailable.)
Image Credits: AI Generated
DOI: Not provided
Keywords: brain imaging, cerebral blood flow, arterial spin labeling, seven-tesland MRI, cortical layers, mitochondrial capacity, cellular organization, neurovascular coupling, gene expression, BigBrain atlas, brain, imaging
News Source: Cassandra Pierce. (October 26, 2026). New MRI index maps blood flow to brain cell energy needs. Scienmag.