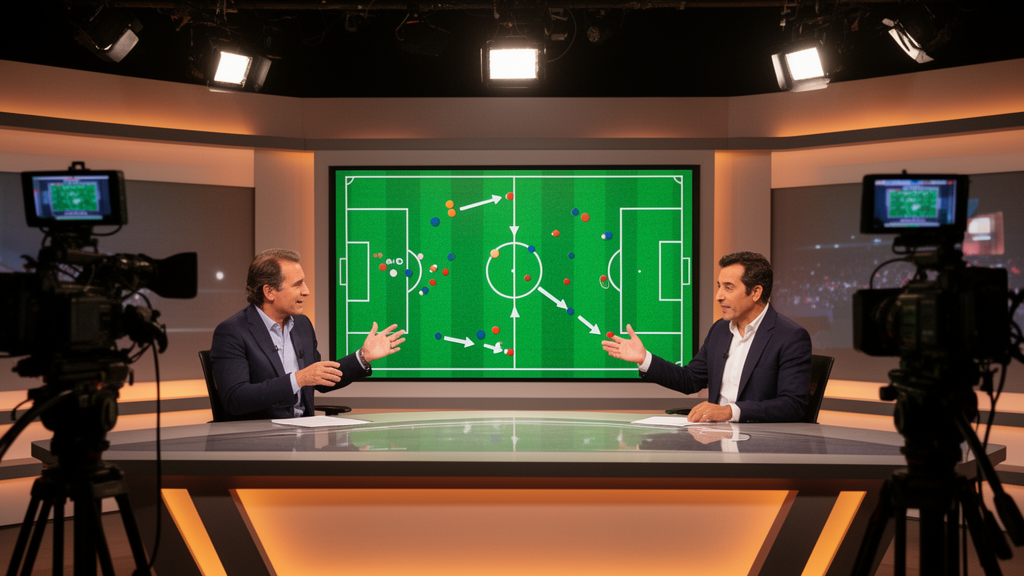
Data visualization has become one of the most talked-about tools in modern journalism, promising richer storytelling and deeper audience engagement. A content analysis of 257 pieces published around Liga MX finals between 2012 and 2023 found that static charts dominated the visual repertoire, while features that let readers actively explore, configure, or personalize data were almost entirely absent.
The researchers compiled a census of every published piece—a web article, visualization, video, or social media post—that appeared within a one-week window around each Liga MX final, from the Sunday before the match to the Sunday after, and contained at least one informative visual element related to the final. Clausura 2020 was excluded because the tournament was cancelled during the COVID-19 pandemic.
The results paint a picture of an editorial culture that has embraced visuals but not interactivity. Static charts accounted for 174 of the 257 pieces, or 67.7 percent of the corpus. Interactive charts appeared in 44 cases, videos in 30, and infographics in just 8. Websites were by far the dominant publishing platform, hosting 228 of the pieces, compared with 19 on Instagram, 8 on Facebook, and a single publication each on Twitter and YouTube. TUDN produced the largest share of visual storytelling content with 51 pieces, followed by ESPN with 38 and Récord with 36, while La Afición contributed 6.
Interactivity, when measured separately from visual format, was somewhat more common but still limited. The researchers distinguished between what a piece looks like and what a user can actually do with it, noting that a predominantly static chart may still include navigational components such as scrolling narratives, tabs, galleries, or dropdown menus. Under this measure, 53.7 percent of the pieces were classified as static, while 46.3 percent—119 cases—incorporated some level of interactivity. But the depth of that interaction was shallow: 53.3 percent of the content was read-only, 46.3 percent allowed interactive navigation, and only a single piece in the entire twelve-year corpus enabled user personalization, meaning readers could intervene in how content was configured or compared.
The narrative structures embedded in the visualizations were equally revealing. The most common data narrative was change over time, appearing in 115 pieces, followed by connection and flow or correlation in 49, comparison in 25, geolocation in 15, and just one case each of concept visualization and prediction. Thematically, historical narrative dominated with 137 pieces, followed by game statistics with 52, tactical analysis with 29, performance with 20, and football economics with a marginal 9. At the same time, granularity was heavily skewed toward the individual event: 198 pieces, or 77 percent of the corpus, analyzed the match level, while only 28 focused on teams, 14 on tournaments, and 9 on individual players. The authors interpret this as a largely commemorative rather than analytical use of data—visualizations were most often deployed to remember, narrate, or revisit finals rather than to explain, predict, or explore broader patterns.
Authorship patterns added another dimension to the findings. Visible publication credits attributed 99.6 percent of the pieces—256 of 257—to a single creator, with only one case listing more than one creator. The researchers are careful to note that this does not demonstrate the absence of uncredited collaboration behind the scenes; journalists, designers, programmers, and data analysts may well have contributed without appearing in the credits. What the pattern does show, they argue, is that interdisciplinary roles were rarely made visible, which makes it difficult to assess how collaborative workflows contribute to the narrative, technical, and aesthetic development of data-driven journalism.
On the positive side, the corpus showed strong practices in source attribution. All 257 pieces mentioned a data source, and in 256 cases—99.6 percent—the source was accessible to readers. However, the coding scheme did not assess licensing, downloadability, reusability, or documentation, so the researchers caution that broader open-data practices cannot be inferred from these results. Another documentation gap emerged around the number of visualizations per piece: 201 cases were coded as not reported, which prevented the team from examining how the quantity and sequencing of visual elements relate to narrative complexity. The authors stress this should be treated as a coding constraint rather than evidence of absent editorial standards.
The study’s methodological choices shape how far its conclusions can travel. The researchers did not compute a formal intercoder reliability coefficient such as Krippendorff’s alpha, instead relying on explicit operational definitions, decision rules, and joint review of ambiguous cases—a decision they justify by the exploratory, descriptive aims of the project but acknowledge as a clear avenue for improvement. The corpus is also deliberately bounded: it covers only finals, only a one-week window around each final, only the platforms represented in the corpus, and only nine established outlets with robust digital infrastructure. Local, regional, independent, and fan-based media were not included, and television, radio, podcasts, and mobile apps were outside the scope. The authors emphasize that the findings characterize this specific corpus and should not be generalized to all Mexican sports journalism or the broader digital media ecosystem.
Crucially, the study measures the affordances built into published artifacts, not audience behavior. No reception research, usability testing, behavioral analytics, or user interviews were conducted, so the findings cannot establish how audiences understood, navigated, trusted, remembered, or emotionally responded to the visualizations. References to human interaction describe the opportunities the publications offered, not evidence of what users actually did with them. The temporal span from 2012 to 2023 likewise does not constitute a formal longitudinal analysis; the yearly distribution of publications, which peaked at 41 pieces in 2022 and 27 in 2023, is descriptive only.
Within those limits, the authors argue the corpus reveals a recurring configuration: static formats predominate, interaction rarely goes beyond navigation, narratives are historical and temporal, analysis concentrates on the single match, and collaboration is seldom visible. They call for production models that treat data visualization not merely as graphic support but as an interdisciplinary narrative strategy—making collaborative roles visible, embedding visualizations in coherent story structures, exploring levels of analysis beyond the single match, and designing interaction mechanisms that support genuine active exploration. Such recommendations, the researchers note, arise from a corpus-bounded exploratory study and require validation through comparative, longitudinal, and audience-centered research before they can be considered established practice for the field.
Subject of Research: Data visualization and interactive storytelling practices in Mexican digital sports media coverage of Liga MX finals
Article Title: Visual storytelling and human interaction in Mexican sports journalism
Article References: Garcia-Hernandez, M., & Castillo-Soto, A. (2026). Visual storytelling and human interaction in Mexican sports journalism. Frontiers in Computer Science, 8, Article 1823250. https://doi.org/10.3389/fcomp.2026.1823250
Image Credits: AI Generated
DOI: 10.3389/fcomp.2026.1823250
Keywords: data visualization, visual storytelling, sports journalism, Liga MX, Mexico, interactivity, content analysis, digital media, human-data interaction, soccer, media studies, Frontiers in Computer Science
News Source: Denise Maddox. (October 28, 2026). Mexican Sports Media Lean on Static Graphics in Liga MX Final Coverage, Study Finds. Scienmag.