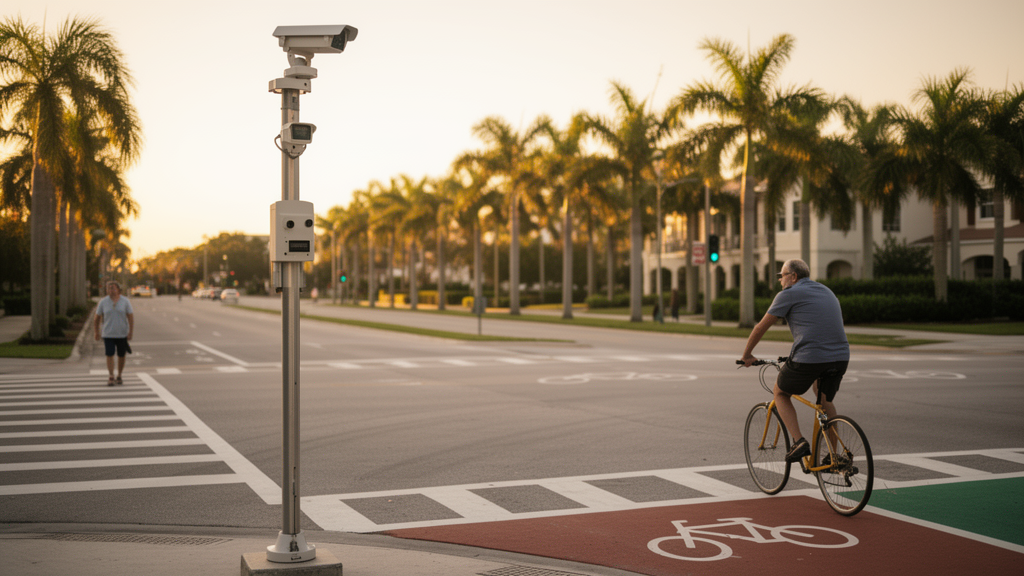
Pedestrians and bicyclists in Florida faced a measurably different injury landscape after the COVID-19 mobility disruption, according to a new open-access study published in Discover Civil Engineering that analyzed 60,300 crashes recorded between 2017 and 2019 and between 2021 and 2023. Using five classification models, including Random Forest and XGBoost, alongside formal statistical transferability tests, researchers found that the relationships between crash characteristics and injury severity were not stable across the two periods. Yet the study’s most striking result concerns what varied even more than time: whether the victim was walking or cycling.
The research team, drawing on the Signal Four Analytics database of Florida pedestrian and bicyclist crashes, deliberately excluded 2020 as an atypical transition year marked by disrupted travel demand, work arrangements, and mobility patterns. The final analytical dataset contained 29,588 crashes in the earlier period and 30,712 in the later one. Injury outcomes were coded on the KABCO scale, with severe crashes defined as fatal (K) and incapacitating (A) injuries, and moderate crashes as non-incapacitating (B) and possible (C) injuries. Property damage only crashes were excluded to focus on injury events. Severe outcomes represented 23.7 percent of observations overall, at 24.1 percent in the earlier period and 23.3 percent in the later period, an imbalance toward moderate injuries that shaped the entire modeling strategy.
The authors tested whether the statistical relationships linking explanatory variables to injury severity held across the two periods using a likelihood ratio test of model transferability. The test rejected parameter stability between 2017–2019 and 2021–2023, producing a chi-square statistic of 44.07 with 21 degrees of freedom and a p value of 0.002. But when the same test compared separately estimated pedestrian models with bicyclist models, the statistic reached 978.54 on the same degrees of freedom, more than twenty times larger. Road user mode, in other words, was a substantially stronger source of variation in the pooled data than the study period itself, a finding that justifies treating these two vulnerable road user groups separately despite their conventional grouping.
Model performance itself delivered a sobering message. All five models, which also included Linear Discriminant Analysis, Quadratic Discriminant Analysis, and Logistic Regression, achieved overall accuracy between 75 and 79 percent, but the majority class baseline was already 75.89 percent in the earlier period and 76.71 percent in the later one. No model exceeded that baseline by more than roughly two percentage points, and severe injury recall ranged from 18.64 to 30.96 percent, meaning the models correctly identified only a minority of severe crashes at the default decision threshold. Threshold-independent measures told a fairer story: precision-recall AUC values between 0.398 and 0.479 were approximately twice the prevalence of severe injury in the test partition, indicating genuine but limited discriminative capability. The authors conclude that administrative crash report variables alone separate severe from moderate vulnerable road user outcomes only weakly.
To rank predictors without the cardinality bias that affects impurity-based feature importance in tree ensembles, the study relied on permutation importance computed on held-out data. Posted speed limit emerged as the highest-ranked predictor, followed by time of day and non-motorist age, while sex and weather contributed relatively little. Partial dependence analysis showed predicted severe injury probability rising from approximately 0.191 on roads posted at 35 MPH and below to approximately 0.324 on roads posted at 40 MPH and above in the earlier period, and from 0.185 to 0.314 in the later period, a stable relationship in both direction and magnitude. Impairment produced the largest single effect of any variable, lifting predicted severity from roughly 0.236 where no impairment was recorded to approximately 0.423 where it was.
The mode-specific analysis sharpened these contrasts considerably. Posted speeds of 40 MPH and above were associated with severity increases of approximately 28 percentage points for pedestrians but only about 13 percentage points for bicyclists. The gap between nighttime and off-peak conditions was similarly lopsided, at roughly 28 points for pedestrians versus 14 for bicyclists, with nighttime crashes showing predicted severity near 0.34 compared with 0.19 to 0.22 across daytime categories. Conversely, unpaved shoulders mattered far more for bicyclists, at approximately 8 percentage points against 3 for pedestrians. Effect directions were consistent across both groups in every case, but the magnitudes were not, which the authors say means a pooled specification returns a weighted average that represents neither group precisely.
Several results revised interpretations common in earlier crash research. Intersection-related crashes were consistently less severe than non-intersection crashes in both periods, at roughly 0.215 versus 0.255 predicted severity earlier, consistent with the distinction between crash frequency and severity: intersections concentrate conflicts and therefore crashes, while midblock locations involve higher approach speeds and less controlled crossing movements. Distraction was associated with slightly lower rather than higher predicted severity, a pattern the authors attribute to distraction-flagged crashes being disproportionately recorded in lower-speed urban settings, and report strictly as an association. Speeding, although linked to higher severity where recorded, was flagged in fewer than 0.7 percent of crashes and ranked last among all predictors, so the study explicitly declines to draw conclusions about its changing contribution at this sample size.
The temporal picture within the later period complicates any simple before-and-after narrative. Severe injury share rose above pre-pandemic levels in 2021, reaching 25.38 percent and exceeding every year in the earlier period, before declining steadily to 21.52 percent by 2023. The 2017–2019 period, by contrast, was highly stable, with the severe share varying by only 0.19 percentage points across three years. Part of the later decline was compositional: the pedestrian share of crashes fell from 55.8 percent in 2017 to 49.8 percent in 2023, and pedestrian crashes are considerably more severe than bicyclist crashes, whose own severe injury share dropped from 17.3 percent to 14.3 percent while the pedestrian share stayed comparatively stable at 29.4 to 28.8 percent. Crash volume remained below earlier levels in 2021 before recovering through 2023.
The authors are careful about causation. The findings are interpreted as evidence of temporal variation in injury severity relationships rather than causal effects of the pandemic, since contemporaneous changes in travel behavior, roadway exposure, enforcement, economic activity, and mobility patterns may also have contributed. The design is observational, police-reported crash records do not capture pedestrian and bicyclist exposure volumes, and documented underreporting of less severe crashes during the pandemic would itself affect a severity share comparison. Florida’s focus also limits generalizability, though the state’s consistently high pedestrian and bicyclist fatality rates make it a consequential case study.
Practically, the results point to differentiated countermeasures rather than one-size-fits-all programs. The findings support targeted speed management on corridors posted at 40 MPH and above, improved roadway and crossing illumination, enhanced pedestrian conspicuity, and nighttime speed management where pedestrian activity is substantial. Impairment-related severity supports focused enforcement and prevention, while older non-motorists, whose predicted severity climbed monotonically from roughly 0.198 for those aged 19 and below to 0.301 for those 65 and above in the earlier period, may benefit from refuge islands, shorter crossing distances, and longer pedestrian clearance intervals. Bicyclist priorities include shoulder improvement and greater separation on segments with unpaved shoulders. Rural corridors, which showed higher severity than urban areas in both periods, warrant targeted engineering review of operating speeds, visibility, and crossing conditions.
Subject of Research: Temporal changes in pedestrian and bicyclist crash severity in Florida analyzed with machine learning models
Article Title: Changes in pedestrian and bicyclist crash severity before and after COVID 19 using machine learning models
Article References: Mdimi, O. M., & Kasubi, F. (2026). Changes in pedestrian and bicyclist crash severity before and after COVID 19 using machine learning models. Discover Civil Engineering, 3(1), Article 259. https://doi.org/10.1007/s44290-026-00646-0
Image Credits: AI Generated
DOI: 10.1007/s44290-026-00646-0
Keywords: pedestrian safety, bicyclist safety, crash severity, machine learning, XGBoost, Random Forest, COVID-19, Florida, temporal transferability, speed limit, vulnerable road users, traffic safety
News Source: Teresa Odom. (October 29, 2026). Machine learning traces shifting crash severity for Florida pedestrians and bicyclists. Scienmag.