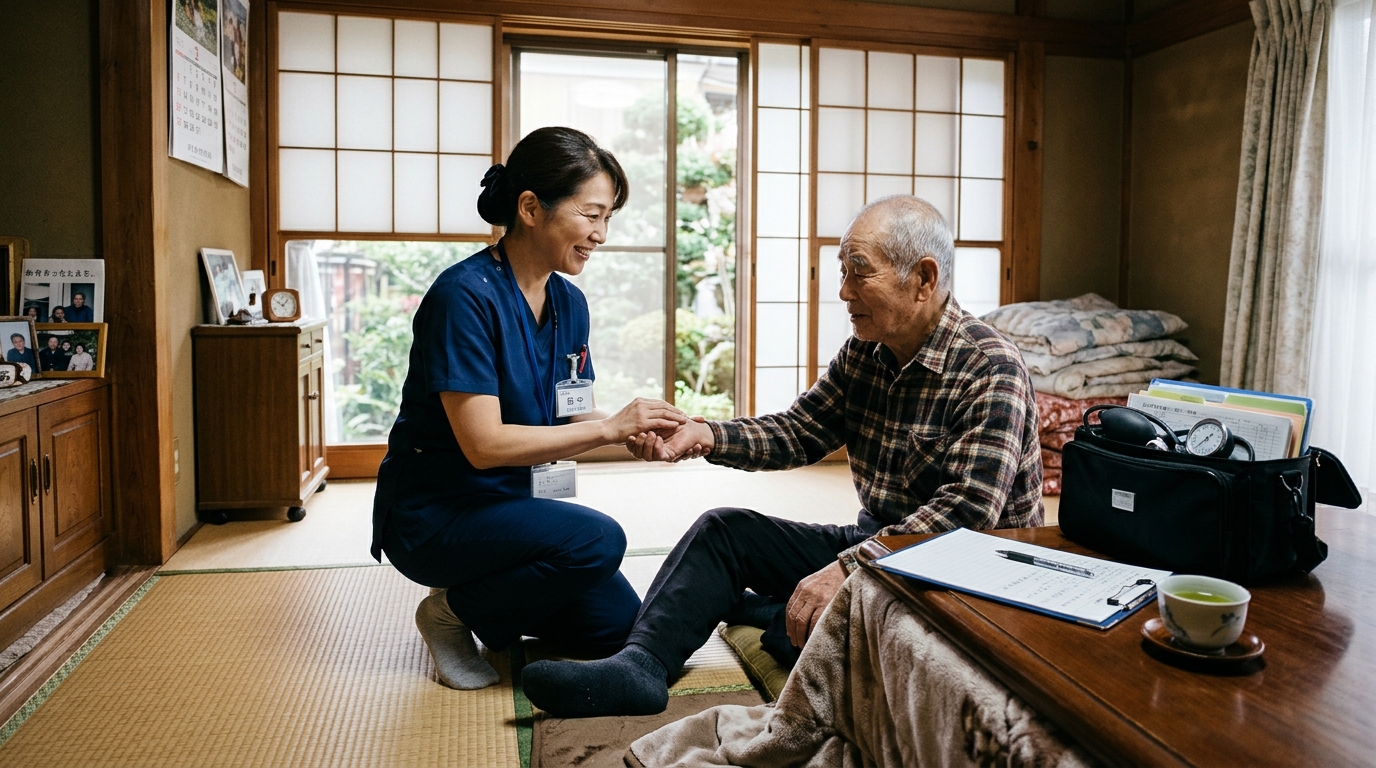
Japan’s universal long-term care insurance system was built on a simple promise: older adults should be able to age at home, and the state will help pay for it. Yet a nationwide analysis of 1,494 municipalities has found that the share of insured older adults actually receiving home-based services swings from 2.6 percent to 18.9 percent depending on where they live, with high-use areas clustered in western Japan and low-use pockets concentrated in the center and north of the country.
The study, published in BMC Global and Public Health, is a cross-sectional analysis of municipal-level administrative data as of December 2024, drawn from the Ministry of Health, Labour and Welfare’s Long-Term Care Insurance Status Report, the 2020 Population Census, and compiled municipal care and finance datasets. Because it is an ecological study, its findings describe associations between municipal characteristics and service use at the population level, not individual behavior, and the cross-sectional design rules out any claim about what causes what.
Home-based services under Japan’s long-term care insurance system cover 12 service types in four groups: home-visit care, bathing, nursing and rehabilitation; outpatient day care and day rehabilitation; short-term stays for care or recuperation; and other services such as rental of welfare equipment and designated residential care. These are the services that let people with disabilities stay in familiar surroundings rather than move into institutions. The researchers excluded 44 municipalities belonging to wide-area unions, joint administrative bodies that act as insurers for multiple municipalities, and 35 municipalities without geographic neighbors, mostly remote islands, leaving 1,494 of Japan’s 1,741 municipalities in the sample.
To test whether the uneven map was more than noise, the team ran spatial autocorrelation analyses. The Global Moran’s I statistic came in at 0.473 with a z value of 26.835 and a pseudo p-value below 0.001, a statistically significant positive autocorrelation that rejects the null hypothesis of spatial randomness. In plain terms, municipalities with high home-care use tend to sit next to other high-use municipalities, and low-use areas cluster together as well. Local Moran’s I analysis pinpointed 207 High-High clusters, 27 High-Low outliers, 29 Low-High outliers, and 192 Low-Low clusters at the 5 percent significance level. High-High clusters sat mainly in western Japan, while Low-Low clusters concentrated in Kanto, Tohoku, and Hokkaido.
The researchers then modeled what explains the variation, organizing candidate factors after the Andersen-Newman framework into need, predisposing, and enabling categories. Need was measured as the share of older adults certified as requiring long-term care across support levels 1 to 2 and care levels 1 to 5. Predisposing factors included the share of residents aged 75 and older, three-generation households, older adults living alone, employment rates, unemployment, and the share of residents whose highest schooling was elementary or lower secondary. Enabling factors split into system resources, such as municipal financial strength, care managers per 1,000 insured persons, and region type, and service supply, namely institutional care capacity and the density of non-institutional care providers.
Four ordinary least squares models built up the picture step by step. Need alone explained 45.5 percent of the variation; adding predisposing factors lifted that to 64.7 percent; system resources nudged it to 69.5 percent; and service supply brought the full model to an adjusted R-squared of 71.3 percent. But the residuals of that full model still showed significant spatial autocorrelation, with a Moran’s I test statistic of 175.63 on a chi-square distribution and p below 0.001, so the team estimated spatial regression models. The spatial error model won on fit criteria, with a spatial error parameter of 0.451, p below 0.001, and it explained the same 71.3 percent of variance.
Across both the non-spatial and spatial models, the need factor dominated, with standardized coefficients of 0.478 and 0.476 respectively, both p below 0.001. Low educational attainment showed a consistent negative association, β = −0.053 in both models. Care manager availability was positively associated in both. Rurality mattered: small urban municipalities showed lower utilization than large urban ones, and rural municipalities lower still, with a coefficient of −0.007 in the spatial model. Institutional care capacity was negatively associated, while non-institutional care provider density was positively associated. Average annual income, notably, was not associated with utilization in any model.
Stratified analyses revealed that these associations shift across the urban-rural gradient. The need factor remained the strongest predictor but weakened from large urban (β = 0.553) to small urban (β = 0.487) to rural areas (β = 0.414), all p below 0.001. The negative educational attainment association appeared only in small urban and rural municipalities. Municipal financial strength was significant only in rural areas, where the authors suggest supplemental fiscal resources may help overcome structural barriers such as low population density and provider recruitment difficulties. Non-institutional provider density lost significance in rural areas, which the authors interpret as possibly reflecting geographic access barriers or greater reliance on informal and institutional care pathways despite the presence of providers.
The authors are careful about interpretation. The cross-sectional design cannot determine whether more care managers drive higher service use or whether high-demand municipalities simply employ more of them. The aggregated utilization measure blends 12 service categories, masking patterns specific to any one service. The provider density measure may double-count organizations licensed for multiple service categories. Community-based services were analyzed separately because their utilization was much lower, with a mean of 2.5 percent, and combining them produced poor model fit. Cultural norms around family care obligations, individual care preferences, and unmet needs are not captured in the administrative data at all.
Still, the headline finding stands: under a universal insurance system with nationally standardized benefit ceilings, where people live is strongly associated with how much home-based care they receive. The authors argue that universal coverage alone does not ensure geographically equitable utilization, and that closing the gap will require locally sensitive policy that accounts for differences in care needs, socioeconomic context, and local service availability. Whether similar levels of need translate into equivalent services regardless of geography, they note, is a question for future multilevel research combining individual and municipal data.
Subject of Research: Geographic variation in home-based long-term care utilization across Japanese municipalities under the universal long-term care insurance system
Article Title: Geographic variation and factors associated with home-based long-term care utilization across municipalities in Japan
Article References: Sakamoto, J. L. (2026). Geographic variation and factors associated with home-based long-term care utilization across municipalities in Japan. BMC Global and Public Health, 4(1), Article 87. https://doi.org/10.1186/s44263-026-00314-6
Image Credits: AI Generated
DOI: 10.1186/s44263-026-00314-6
Keywords: Japan, long-term care insurance, home-based services, spatial analysis, municipalities, aging in place, health services utilization, geographic disparities, spatial autocorrelation, rural health, Andersen-Newman model, cross-sectional study
News Source: Ophelia Keating. (November 5, 2026). Japan’s Home Care Use Varies Sharply Across Municipalities Despite Universal Coverage. Scienmag.