Arterial stiffness is one of the quiet warning signs of cardiovascular disease, and the two measurements most often used to track it — pulse wave velocity and blood pressure — are usually taken with separate devices, separate protocols and separate visits. Writing in Artery Research, the researchers describe a dual-site ultrasound system that estimated pulse wave velocity and systolic blood pressure simultaneously from radio-frequency ultrasound signals, with accuracy close to that of commercial reference instruments in an artificial circulatory loop.
The work is a proof of concept, not a clinical validation. All experiments were performed on an arm phantom connected to a circulatory mock-loop, a benchtop replica of the systemic circulation in which pressure, flow and fluid properties can be set and varied at will. Within that controlled environment, however, the system reproduced hemodynamic conditions ranging from hypotension to hypertensive crisis, and the results offer a detailed map of which signal-processing choices matter most when ultrasound is asked to do two jobs at once.
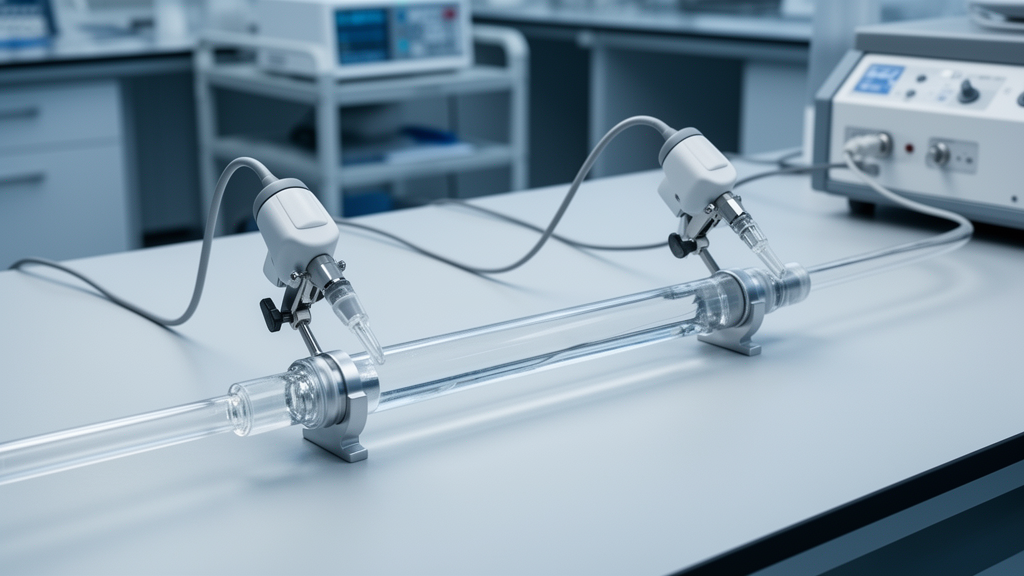
The hardware itself is deliberately simple. Two custom one-channel piezoelectric probes, each with a 5 MHz resonance frequency and a focus distance of 21.1 mm, were placed 6 cm apart along a silicone tube embedded in the arm phantom. Dedicated pulser-receivers drove the probes at a pulse repetition frequency of 1.5 kHz, and the returning echoes were captured, filtered and amplified by custom echo receivers. Together with a commercial reference pressure sensor at the phantom inlet, all signals were recorded simultaneously on an oscilloscope and analysed offline. From the time-of-flight between the echoes of the tube’s anterior and posterior inner walls, the researchers reconstructed the vessel diameter waveform at each site, frame by frame.
Pulse wave velocity follows from the pulse transit time between the two diameter waveforms divided by the known 6 cm separation. But the transit time depends on which fiducial point you pick on each waveform, and the literature offers no consensus on the best choice. The team therefore compared six strategies head-to-head on identical data: maxima and minima of the first and second derivatives, the 25 percent pulse height point, cross-correlation, and the tangent intersection method. Under normotensive conditions, the tangent intersection approach came closest to the reference values from a PulsePen tonometer, with a mean difference of just 0.3 m/s and a confidence interval spanning −1.9 to 2.5 m/s. Cross-correlation and the 25 percent pulse height method deviated significantly from the reference, while the derivative-based methods produced large numbers of outliers, likely caused by small shifts introduced when filtering noisy derivative signals.
The short 6 cm probe separation was itself a calculated compromise. Because pulse wave velocity is inversely proportional to transit time, a short segment yields very small transit times, so even minor timing errors inflate the velocity estimate substantially. A longer baseline would dampen that sensitivity but would blur the local, short-segment hemodynamics the system is designed to capture. The authors note that probe contact force, adjusted by hand to obtain stable signals without deforming the vessel wall, was not quantitatively controlled, and they recommend explicit standardization of contact pressure in future work.
Blood pressure estimation posed a different challenge. The team tested three hemodynamic equations that convert arterial distension into a pressure waveform: a linear diameter-to-pressure relation, an exponential pressure-area model with a stiffness coefficient, and a logarithmic formulation derived from the Bramwell–Hill equation that takes local pulse wave velocity as an input. Each equation was calibrated once per measurement set using the reference sensor’s diastolic and mean arterial pressure, and performance was judged on how well the equations predicted systolic pressure, the only independently estimated parameter, across hypotensive, normotensive, hypertensive and hypertensive crisis conditions.
The linear equation won decisively. It achieved a mean difference of −1.8 ± 1.1 mmHg in systolic pressure against the reference sensor and passed the acceptance thresholds of the ISO 81060-2, British Hypertension Society and IEEE cuffless standards with Grade A in every pressure range. The logarithmic Bramwell–Hill equation performed nearly as well, trailing by only 0.3 mmHg in mean difference. The exponential equation, despite being the most widely used in the ultrasound literature, fared worst: it overestimated systolic pressure with a mean difference of 5.6 ± 1.7 mmHg and failed the ISO and BHS criteria in all conditions except hypertensive crisis, though it remained within IEEE cuffless limits throughout. The authors stress that these results characterize performance under controlled benchtop conditions rather than constituting formal regulatory validation.
One of the study’s more striking findings concerns the circulating fluid. With deionized water running through the loop, the mean pulse wave velocity across all pressure conditions was 15.6 ± 4.0 m/s, sitting at or above the upper end of the 5–15 m/s range reported for in vivo measurements in smaller arteries. When the team switched to a 40 wt% glycerol solution whose viscosity closely approximates that of blood, the mean pulse wave velocity dropped by 4.7 m/s to 10.9 ± 2.4 m/s, bringing every pressure condition squarely into the physiological range. At an even higher viscosity, 50 wt% glycerol, the mean rose again to 13.8 ± 5.7 m/s. This decrease followed by an increase mirrors a turning-point behaviour in the viscosity–pulse wave velocity relationship that other groups have described mathematically and experimentally, although the turning point in this work lay at or above 3.6 mPa·s. The wide spread of values at the highest viscosity may reflect bubble formation or greater attenuation of the ultrasound signal, both of which would degrade peak detection.
The mock-loop itself had limits at the high end of the pressure scale. Hypotensive and normotensive conditions were reproduced accurately at 90/40 mmHg and 120/60 mmHg, but the hypertensive and hypertensive crisis settings, achieved at 140/70 and 235/120 mmHg, could not simultaneously match literature values for systolic, diastolic and pulse pressure, because the pulse pressures generated were roughly 20 and 60 mmHg too high respectively. Reaching physiologically consistent pulse pressures at high pressures would require modifications to the system’s compliance and resistance configuration, such as additional flow-restricting elements or narrower downstream tubing.
For now, the message is one of technical feasibility. A pair of image-free ultrasound probes 6 cm apart, paired with tangent intersection transit-time estimation and a linear diameter-to-pressure equation, tracked both vascular stiffness and blood pressure with errors of roughly 0.3 m/s and 1.8 mmHg in a reproducible benchtop model. The authors envision the system first for local vascular assessment and, with probes placed further apart, for regional measures such as carotid-femoral or brachial-ankle pulse wave velocity.
Subject of Research: An in vitro evaluation of a dual-site ultrasound system for simultaneous blood pressure and pulse wave velocity estimation
Article Title: Dual-Site Ultrasound for Simultaneous Assessment of Blood Pressure and Pulse Wave Velocity
Article References: Gonçalves Seabra, A. C., Fischbach, A., Amado-Rey, A. B., & Stieglitz, T. (2026). Dual-Site Ultrasound for Simultaneous Assessment of Blood Pressure and Pulse Wave Velocity. Artery Research, 32(1), Article 34. https://doi.org/10.1007/s44200-026-00130-1
Image Credits: AI Generated
DOI: 10.1007/s44200-026-00130-1
Keywords: ultrasound, pulse wave velocity, blood pressure, vascular stiffness, cardiovascular risk, mock-loop, phantom study, pulse transit time, cuffless blood pressure, biomedical engineering, hemodynamics, proof of concept
News Source: Ophelia Keating. (October 29, 2026). Dual-Site Ultrasound Measures Blood Pressure and Pulse Wave Velocity at Once in Phantom Study. Scienmag.