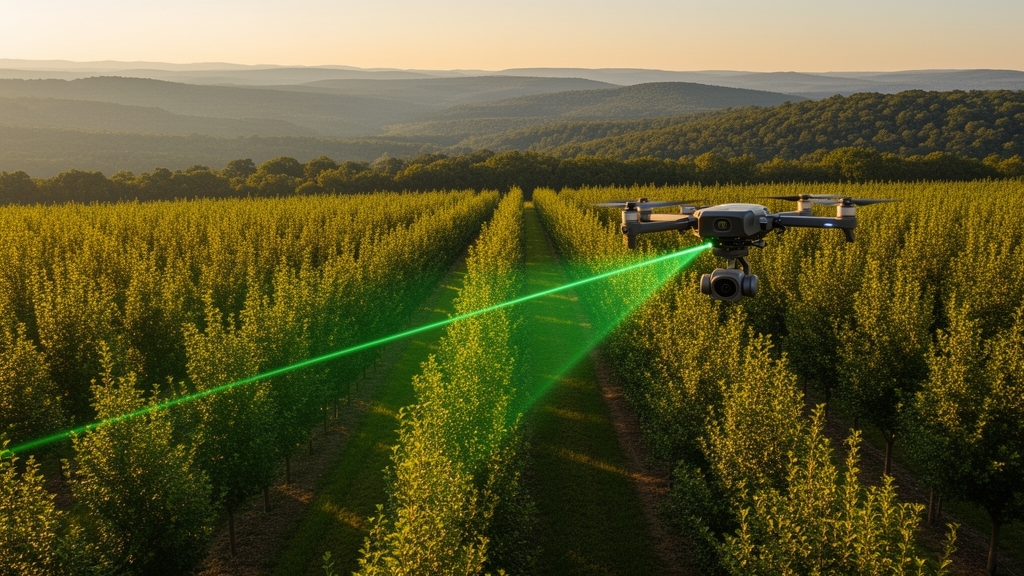
Forest growth models are the quiet workhorses of timber management. They tell planners how a stand of trees will look in ten, twenty or fifty years, how much wood it will hold, and when thinning or harvest makes sense. Building them, however, has always been expensive: it demands years of repeated field surveys in which crews walk plots, measure every trunk and climb through the canopy with hypsometers. A new study from northeastern China shows that much of that labor can be replaced by laser scans from a drone, at least for the even-aged plantations that dominate the region’s timber production.
Researchers at Mengjiagang Forest Farm in Heilongjiang Province developed a dynamic stand-level growth and yield model for Larix olgensis A. Henry, the most widely distributed conifer of the northeastern forest region and China’s fourth most important plantation species for timber production. According to the Eighth National Forest Inventory, the species covers 10.835 million hectares in China, of which 3.163 million hectares are plantations. The northeastern forest region holds roughly one-third of the nation’s total growing stock, so the quality of management in these plantations carries national weight for both timber supply and ecological security.
The study area covers approximately 167 square kilometers on the western foothills of the Wanda Mountain Range, with elevations from 170 to 575 meters, a mean annual precipitation of 523.2 millimeters and a growing season of about 135 days. Larix olgensis occupies 35 percent of the forest farm’s total area and 52 percent of its planted forest area. In August 2019, the team established three rectangular study areas of 1.0 by 1.5 kilometers and set out 47 permanent sample plots, each 0.09 hectares, measuring 30 by 30 meters. In every plot they recorded the diameter at breast height of all trees above 5 centimeters, measured heights with a hypsometer, and noted each species, using only live standing trees for model construction.
The critical innovation was the pairing of field work with two drone laser surveys. LiDAR data were acquired on 12 August 2019 using a DJI Matrice 600 Pro UAV carrying a RIEGL VUX-1UAV scanner, and again on 9 August 2023 with the same platform and identical flight parameters: a flying height of 180 meters, a speed of 10 meters per second, a 330-degree scanning angle, 50 percent swath overlap, a pulse repetition frequency of 380 kilohertz and an average of five returns per pulse. Mean point density was 136 points per square meter in 2019 and 145 in 2023. Because the sensor and flight configuration were held constant, systematic differences between the two point clouds were minimized, which matters greatly when the goal is to detect genuine forest change rather than instrument artifacts.
After a resurvey of the plots in August 2023, seven thinned plots and one plot with anomalous mortality were excluded, leaving 39 plots for analysis. From the raw point clouds the researchers removed noise, classified ground and non-ground returns with the Improved Progressive TIN Densification algorithm, and normalized heights against the interpolated ground surface. Using LiDAR360 software they extracted 101 metrics in four groups: 46 height-related metrics, 10 density-related metrics, 42 intensity-related metrics, and additional canopy indices including gap fraction, leaf area index and canopy cover.
To turn those metrics into stand variables, the team used a k-nearest-neighbors imputation method with three neighbors, described in earlier work by Pukkala and colleagues. Simulated annealing searched for the optimal set of LiDAR variables, transformations and weights defining a weighted Euclidean distance metric; each plot’s stand age, dominant height, stem number and basal area were then imputed as inverse-distance-weighted means of the three most similar field plots in the LiDAR feature space. The authors note that nearest-neighbor methods preserve the distributional shape and variance structure of the original data and keep predictions within biologically reasonable ranges, advantages over pure regression approaches that struggle with the complex interactions between stand variables and forest structure.
The growth models themselves consisted of three simultaneously fitted equations for dominant height, number of trees per hectare and stand basal area, estimated by nonlinear seemingly unrelated regression, which accounts for the mutual dependence among the error terms. Site index, calculated from 2019 age and dominant height, served as a productivity predictor in the mortality and basal-area equations. Three model variants were built: FF, fitted entirely from field measurements in 2019 and 2023, representing the traditional benchmark; FL, combining field data from 2019 with LiDAR-based estimates for 2023; and LL, built wholly from LiDAR-imputed values for both years, assuming no repeated field measurements were available at all.
Testing each model set by simulating every plot from 2019 to 2023 and comparing the results with field measurements revealed a nuanced picture. There were no large differences in root mean square error among the three model sets when they used the same input data, and all parameter estimates were significant. Dominant height simulations were actually best when both the models and the inventory data consisted of LiDAR-based estimates; the bias in dominant height was at most about 10 centimeters over a four-year prediction, and the LiDAR-only model showed the smallest bias. The likely explanation is that several LiDAR metrics correlate closely with canopy height, so drone-derived dominant height may simply be more accurate than field measurements, which are prone to terrain occlusion and observer error.
For the number of trees and basal area, however, field inventory still yielded better simulation results than the LiDAR-based area approach. The most instructive failure was the mixed FL model, which underestimated both variables: it overestimated four-year mortality by 47 or 68 trees per hectare and underestimated basal area development, apparently because errors in the LiDAR-based predictions of these indirectly estimated attributes propagated into the fitted equations. The authors conclude that combining field-measured and LiDAR-based variables in this way cannot be recommended for growth modeling, and suggest that where both data types exist, LiDAR estimates may serve best for dominant height while field measurements serve better for stem number and basal area, though their own field method was a complete tree tally rarely feasible in practice.
The broader message is that growth and yield models built from LiDAR-estimated stand variables can be nearly as good as traditional models based entirely on repeated field measurements, and for dominant height they can be better. Because developing such models has historically required long-term, costly, repeated inventories, bi-temporal drone LiDAR offers a cheap and fast route to simulation and planning tools for plantations. The authors are careful about limits: the conclusions hold only for even-aged Larix olgensis plantations with relatively simple stand structure, the applicability to mixed-species stands could not be evaluated, and attributes like basal area and stem density that cannot be measured directly from point clouds remain constrained by point density, structural heterogeneity and modeling algorithm. Steep terrain may also bias normalized LiDAR metrics. Future work, they write, should test the approach in more complex stand structures, but for the vast monoculture plantations of northeastern China, the drone scan has earned a place alongside, and sometimes ahead of, the measuring tape.
Subject of Research: Using bi-temporal UAV LiDAR estimates to develop stand-level growth and yield models for even-aged Larix olgensis plantations
Article Title: Bi-temporal LiDAR-based estimates of stand variables reduce growth modelling costs in even-aged Larix olgensis A. Henry plantations
Article References: Zhu, B., Pukkala, T., Hao, Y., & Jin, X. (2026). Bi-temporal LiDAR-based estimates of stand variables reduce growth modelling costs in even-aged Larix olgensis A. Henry plantations. Annals of Forest Science, 83(1), Article 48. https://doi.org/10.1186/s13595-026-01365-3
Image Credits: AI Generated
DOI: 10.1186/s13595-026-01365-3
Keywords: UAV LiDAR, forest growth modeling, Larix olgensis, plantation forestry, kNN imputation, bi-temporal remote sensing, stand basal area, dominant height, forest inventory, northeastern China, site index, yield prediction
News Source: Alan Morgan. (October 28, 2026). Drone laser scans slash the cost of forecasting plantation forest growth. Scienmag.