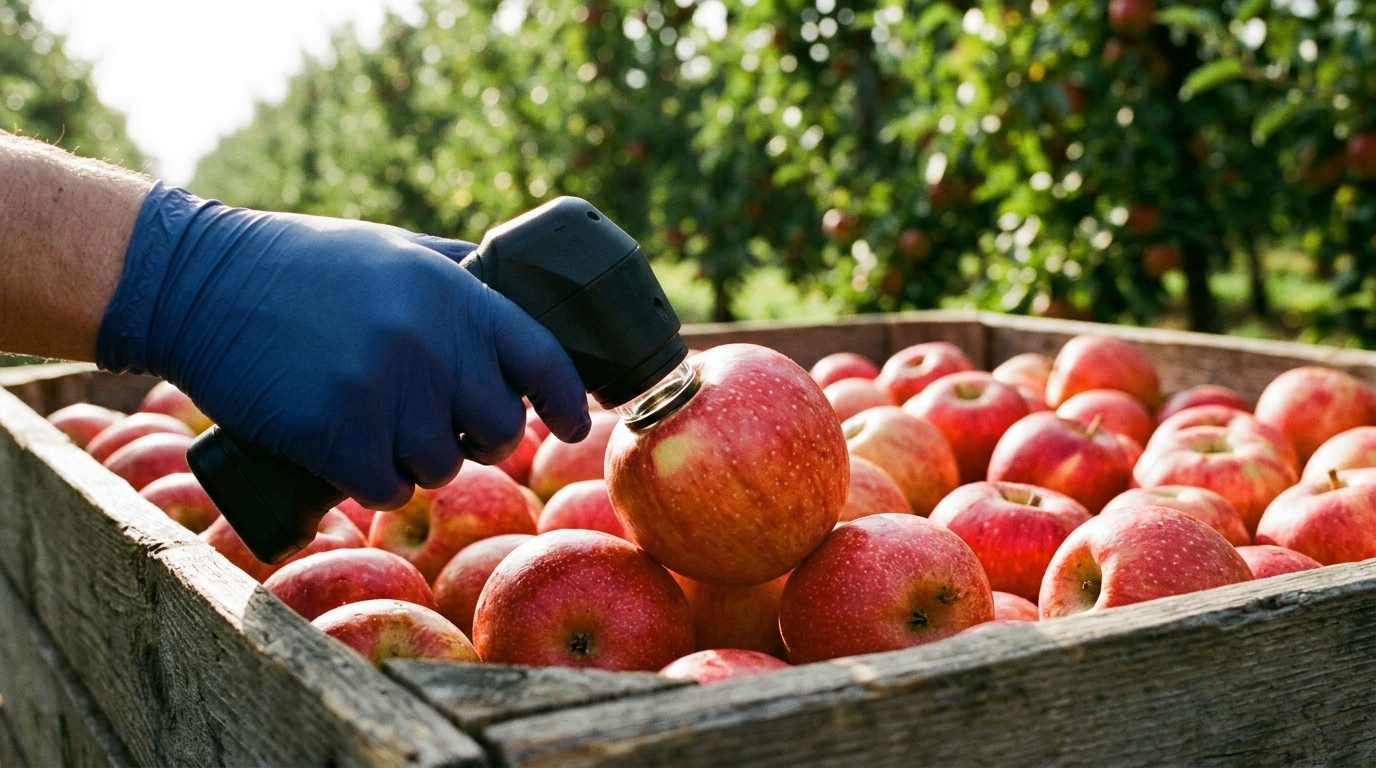
Apple growers and packers rely on visible and near-infrared spectroscopy to measure soluble solids content, the sugar-related quality index that decides fruit sweetness grades, but the calibration models behind those measurements tend to fall apart when a new harvest year arrives. A study of ‘Rock candy heart’ apples from a single orchard in Aksu, Xinjiang, spanning the 2023 to 2025 harvests, now shows how badly that degradation unfolds and how a feature attention mechanism built into a deep network can restore cross-year accuracy using only a fraction of the new season’s samples. The work, published in Artificial Intelligence in Agriculture, combined spectral-ratio analysis, transfer learning, and a custom attention layer to keep a one-dimensional convolutional neural network useful as the fruit’s spectral distribution shifted from year to year.
The scale of the problem was stark. A benchmark 1D-CNN trained on 80 percent of the first harvest year’s samples performed well on its own prediction set, with a coefficient of determination of at least 0.87, a root mean squared error of prediction no higher than 0.63 degrees Brix, and a residual predictive deviation of at least 2.75. When the same model was applied directly, without any updating, to test sets from harvest years 2 and 3, it failed to achieve effective fitting altogether, with negative coefficients of determination on the extrapolation sets. Root mean squared errors of validation ballooned to 5.79 and 3.82 degrees Brix, while the residual predictive deviation collapsed to 0.21 and 0.34. The authors attribute this miscalibration to harvest-year-induced distribution shifts, since differences among growing seasons involve complex variations in solar radiation, precipitation, and accumulated temperature that alter fruit growth, development, and composition.
The reference data itself confirmed genuine interannual differences. Across 835 apples, mean soluble solids content fell from 16.85 degrees Brix in year 1 to 15.77 in year 2 and 15.61 in year 3, and a one-way analysis of variance found a significant interannual difference with an F statistic of 56.84 and a p value of 7.29 times 10 to the power of negative 24. Post-hoc comparisons showed year 1 was significantly higher than years 2 and 3, while years 2 and 3 did not differ significantly from each other. Average spectral profiles also differed visibly among the three years, and wavelength-wise analysis found that 514 of 516 wavelengths in standard normal variate-preprocessed spectra remained significantly different among harvest years, compared with 487 of 516 in raw spectra, indicating that preprocessing reduced global scattering effects without erasing the interannual signal.
To pinpoint where the year-to-year shifts concentrated, the researchers turned to spectral-ratio analysis. By dividing target-year spectra by baseline-year spectra wavelength by wavelength, they could distinguish global effects such as baseline shifts or multiplicative scattering, which produce nearly constant ratios, from bands where the ratio fluctuates sharply and signals genuine differences in intrinsic sample properties. Statistical testing with Benjamini-Hochberg false discovery rate correction identified 690 to 730 nanometers as a significant difference band for both target years, with significant wavelength-dependent variation across the interval. The same interval emerged when the baseline was expanded to include two historical years, making it the consistent target for attention-based recalibration.
The proposed method, called FAM-DNU for feature attention mechanism-based deep network updating, follows an identification-calibration-adaptation logic. First it quantifies the significant spectral bands that differ between years. Then it embeds that difference information into the pre-trained network as a learnable band-wise attention layer placed between the input layer and the first convolutional layer, so the identified differential bands are recalibrated before convolution and pooling mix information from neighboring wavelengths. The attention layer uses a learnable parameter vector transformed by a mapping function; among four candidates tested, a logarithmic mapping produced the smallest average root mean squared error of update, with scenario-specific optimal parameters for each target year. Finally, the network is fine-tuned by transfer learning: all convolutional layers are frozen to preserve the general spectral feature-extraction capability learned from baseline data, while only the attention layer and fully connected layers are updated using a small number of new-year samples.
After updating with 20 percent of the target-year samples, FAM-DNU restored extrapolation performance dramatically. On the two target harvest years, the updated model achieved coefficients of determination of validation of at least 0.58, residual predictive deviation of at least 1.54, and range error ratio of at least 8.79, with root mean squared errors of validation of 0.81 and 0.52 degrees Brix. For year 3 samples, the updated model’s error matched what the benchmark model had achieved on its own same-year prediction set, indicating the updating method largely overcame the impact of year-to-year variation. Across the three cross-year validation scenarios, the method reduced cross-year root mean squared error of validation by 30.43 to 86.42 percent relative to pre-update values, and the improvement held across five independent runs with different random seeds, with standard deviations of validation error remaining below 0.08 degrees Brix.
Head-to-head comparisons against five established strategies, spanning global models, slope/bias correction, recalibration, plain deep network updating, and semi-supervised parameter-free calibration enhancement, showed FAM-DNU among the top performers. The global model, which merges baseline and target-year data, achieved the best numerical extrapolation accuracy but requires a relatively large number of target-year samples, limiting practical use when only limited updating samples are available. FAM-DNU followed closely while using far fewer labeled samples. Sensitivity testing across 5, 10, 15, and 20 percent updating proportions showed that FAM-DNU’s validation error was almost unaffected by sample size, whereas plain deep network updating and the constrained-optimization comparator showed stronger dependence on the number of updating samples. In a multi-year scenario where the baseline combined harvest years 1 and 2 and year 3 served as the target, FAM-DNU raised the coefficient of determination from 0.51 to 0.76 and cut validation error from 0.92 to 0.64 degrees Brix, again trailing only the data-rich global model.
Interpretability was built into the framework rather than bolted on. The authors designed a spectral difference-attention-band contribution method that fuses three sources of information: interannual spectral differences, gradient sensitivity of the model output to each wavelength, and the learned attention weights, producing a band contribution index. The analysis showed the updated model was most sensitive to the 730 to 950 nanometer range, and several wavelengths within the 690 to 730 nanometer difference band contributed substantially to predictions. Statistical testing across 100 independent retrainings confirmed that the attention mechanism significantly increased the contribution of the difference bands, rejecting the null hypothesis that attention does not enhance their contributions. Wavelength-neutralization experiments provided independent validation: replacing the highest-ranked wavelengths with baseline means consistently degraded external prediction, and band-level Spearman correlations between the contribution index and the resulting error increases ranged from 0.547 to 0.614, all statistically significant.
The authors are careful about what the index does and does not mean. High contribution values within the difference band should not be read as pointing to a unique absorption peak of a specific apple sugar, because sucrose, glucose, and fructose produce broad and overlapping responses in the short-wave near-infrared region and fruit soluble solids prediction generally depends on multiband information. Since only total soluble solids was measured, the observed contributions could not be causally assigned to any particular sugar component. The study also notes that spectral difference degree showed only modest positive correlations with attention weights, indicating the attention mechanism redistributed feature weights according to their relevance to prediction rather than simply reproducing the difference pattern.
Limitations frame the path forward. The method has been evaluated only across interannual variability, and its applicability to cultivar, origin, maturity, instrument, and environmental or measurement-condition changes requires systematic validation. The Kennard-Stone sample selection used for updating sets may preferentially include boundary samples, potentially softening the extremeness of the remaining external test set, so future work should test repeated random partitioning or fully independent external batches. Firmness, peel color, individual sugar components, and year-specific meteorological variables were not measured, preventing quantitative separation of the environmental and physiological origins of the spectral shifts. Even so, the demonstration that a frozen feature extractor plus a difference-guided attention layer can hold prediction accuracy steady across harvest years, using only 5 to 20 percent of the new season’s samples, offers fruit-quality laboratories a sample-efficient and interpretable route to keeping their spectral models current as each new crop arrives.
Subject of Research: Explainable deep learning model updating for apple soluble solids prediction across harvest-year variability
Article Title: An explainable deep learning approach based on a feature attention mechanism for maintaining SSC model performance in apples across interannual variability
Article References: Liu, P., An, C., Sun, Z., Xu, H., & Xie, L. (2026). An explainable deep learning approach based on a feature attention mechanism for maintaining SSC model performance in apples across interannual variability. Artificial Intelligence in Agriculture. https://doi.org/10.1016/j.aiia.2026.11.001
Image Credits: AI Generated
DOI: 10.1016/j.aiia.2026.11.001
Keywords: Vis/NIR spectroscopy, soluble solids content, apples, harvest-year variability, deep learning, transfer learning, attention mechanism, model updating, interpretability, 1D-CNN, spectral distribution shift, food quality detection
News Source: Blake Davidson. (November 5, 2026). Attention-Guided Deep Learning Keeps Apple Sugar Models Accurate Across Harvest Years. Scienmag.