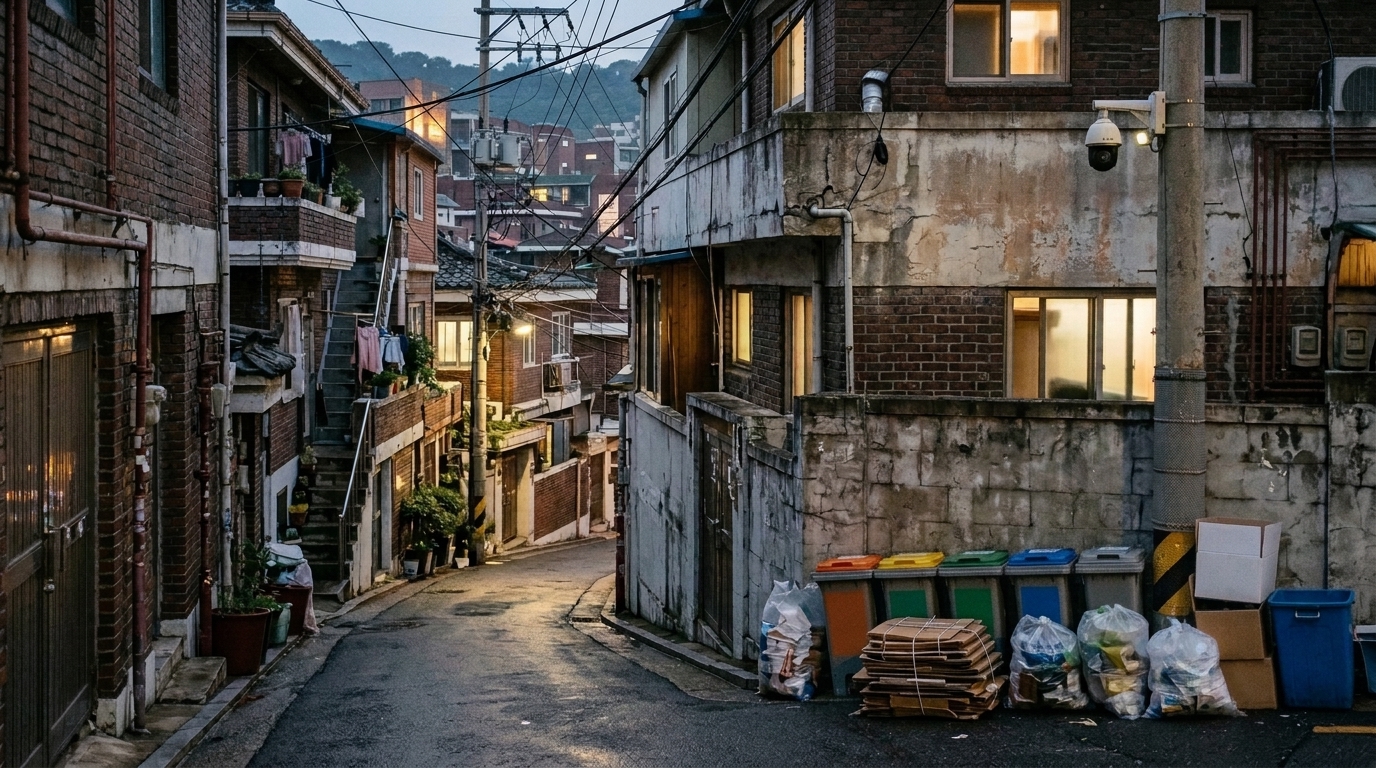
Illegal dumping has become one of Seoul’s most stubborn urban problems, and the city’s response so far has leaned heavily on surveillance cameras and enforcement. Now, researchers have taken a different angle: instead of trying to catch dumpers in the act, they used unsupervised computer vision to ask what the streets around repeatedly problematic locations actually look like. Their analysis of thousands of street-level images revealed three recurring landscape patterns tied to frequent illegal dumping monitoring sites in the South Korean capital.
The study, published in Computational Urban Science, was conducted by Yeorim Kim and Seong-Yun Hong, who collected street-level images from locations in Seoul where surveillance cameras had been specifically installed for waste monitoring. These camera sites served as a practical proxy for places that local authorities had repeatedly identified as problematic, since such cameras are typically installed only after repeated complaints, observations, or administrative recognition of persistent waste disposal problems. The researchers were careful to note that this proxy does not represent a complete inventory of all illegal dumping sites, because vulnerable locations without cameras were not included in the dataset.
The scale of the problem in Seoul gives the work its urgency. The number of illegal dumping reports in the city reached 16,323 in 2023, nearly double the 10,702 reported in 2022, while enforcement actions remained relatively unchanged, with 117,753 cases recorded in 2022 and 124,326 in 2023. Nationally, approximately 1,179,000 tons of waste were illegally discarded in Korea between 2017 and 2021. These figures suggest, the authors argue, that enforcement alone may be insufficient, and that understanding which local environments repeatedly become vulnerable to dumping could support more preventive interventions.
To build their dataset, the researchers started with the locations of all surveillance cameras in Seoul and filtered them to retain only those explicitly installed for waste disposal monitoring. Of the city’s 25 districts, only 11 provided the required data, so the analysis was limited to those districts. The final dataset comprised the coordinates of 1,085 surveillance cameras as of 22 June 2022. From each location, street-view images were captured from four directions at 90-degree intervals, yielding 4,318 images in total. Only the 2,160 images showing the left and right sides were used, because the front and back views predominantly showed roads and offered limited information about adjacent landscapes. The images were resized to 224 by 224 pixels, and the bottom 25 percent of each image was cropped to reduce the influence of image-collection vehicles and other transient foreground objects that occasionally appeared in the frame.
The methodological heart of the study lies in its refusal to rely on manually labelled training data, which is typically expensive and time-consuming to produce for supervised deep learning. Instead, the pipeline extracted high-level visual features from each image using a pre-trained convolutional neural network, reduced the dimensionality of those features, and then grouped the images through unsupervised clustering. The researchers tested two feature extraction architectures, VGG-16 and DenseNet-121, both pre-trained on ImageNet and used as fixed feature extractors with no fine-tuning. They also compared two dimension reduction methods, t-SNE and UMAP, examining both two-dimensional and three-dimensional embeddings before settling on the three-dimensional version because it produced more stable and interpretable cluster structures. For the clustering step itself, they evaluated k-means against HDBSCAN, a density-based algorithm that can identify clusters of varying shapes and treat ambiguous images as noise rather than forcing them into a category.
Model selection was guided by three internal clustering metrics: the Silhouette score, which measures separation and cohesion among clusters; the Calinski-Harabasz index, which evaluates the ratio of between-cluster to within-cluster dispersion; and the Davies-Bouldin index, which assesses cluster compactness relative to separation. Based on the combined evaluation of these metrics and visual interpretability, the final configuration used VGG-16 feature extraction, three-dimensional t-SNE, and HDBSCAN with a minimum points parameter of 37. Each pre-processed image passed through the VGG-16 network to produce a 25,088-dimensional feature vector, which was then compressed to three dimensions before clustering. The resulting model found three clusters among the 2,160 images, containing 275, 108, and 105 images respectively, while images not assigned to any cluster were treated as noise and excluded from interpretation.
The three clusters each told a distinct visual story. The first, and largest, captured mixed-use low-rise landscapes, where low-rise residential buildings sit alongside small commercial establishments, with shopfronts, commercial signs, and building façades suggesting a close interweaving of housing and business, a pattern consistent with older Seoul neighbourhoods. The second cluster represented aged residential landscapes, where commercial signs were less prominent but dense, closely spaced low-rise housing façades dominated, suggesting neighbourhoods where household-level waste disposal practices may be particularly relevant. The third cluster was interpreted as an under-managed landscape, featuring vegetation, utility poles, overhead wires, walls, road edges, and open spaces with limited signs of active management. The authors stress that these elements may not be direct causes of illegal dumping, but they may indicate ambiguous, less maintained, or less visible spaces that previous field-based studies have associated with dumping vulnerability.
Because unsupervised clustering can produce mathematically coherent groups that mean nothing to human eyes, the researchers subjected their results to an external validation experiment. They randomly sampled 200 images, 50 from each of the three landscape clusters and 50 from the noise group, pooled them, shuffled them, and renamed them so that four independent annotators had no access to the original cluster assignments. Each annotator classified every image into one of four categories: mixed-use low-rise landscapes with visible commercial signs, dense aged low-rise residential façades, vegetation-dominated or poorly managed sites, and unclear or unassignable images. Agreement among annotators, measured with Fleiss’ kappa, was moderate at 0.50 for the full set and 0.54 after excluding the noise group. When all clear-majority validation images were compared against the cluster labels, overall accuracy was 55.6 percent, with an adjusted Rand index of 0.29 and normalised mutual information of 0.32. Excluding the noise group raised accuracy to 67.9 percent, with the ARI and NMI rising to 0.48 and 0.47 respectively, and in the subset where at least three of four annotators agreed, accuracy reached 72.4 percent.
The validation also revealed that some patterns were easier for humans to recognise than others. The mixed-use low-rise pattern matched human annotations most clearly, suggesting that commercial signs and mixed-use frontages form a visually recognisable category. The aged residential pattern showed reasonable agreement, though some images were confused with other low-rise urban environments. The under-managed pattern proved more ambiguous, partly because it spanned a wider range of visual elements. To probe what the classifier was actually looking at, the researchers applied Grad-CAM, a gradient-weighted class activation mapping technique, after training a simple image classifier on the cluster labels as pseudo-labels. The resulting heatmaps highlighted commercial signs, shopfronts, and building-street boundaries in the mixed-use cluster, larger portions of residential façades in the aged residential cluster, and vegetation, utility poles, and infrastructure elements in the under-managed cluster. The authors caution that Grad-CAM provides coarse, region-level visual cues rather than object-level labels or causal explanations, and that more detailed validation would require methods such as semantic segmentation or manually annotated saliency masks.
The practical promise of the framework lies in prioritisation rather than replacement. The researchers position it as a scalable screening tool that complements field-based audits by helping local authorities decide which locations warrant closer on-site inspection. Locations screened as mixed-use low-rise landscapes might be checked for disposal guidance, collection schedules, and waste infrastructure for residents and small businesses; aged residential sites might call for resident guidance and centralised disposal points; and under-managed sites might prompt inspection of territorial ambiguity, visibility, lighting, and maintenance conditions. The limitations are equally clear: the camera-location proxy introduces selection bias, the analysis covered only 11 of Seoul’s 25 districts so the patterns may reflect those districts’ urban form and data availability, the manual validation showed only moderate agreement, and factors such as lighting, weather, and seasonality, which could not be controlled in street-view imagery, may still have influenced the feature space. The authors suggest that applying the pipeline to other cities, building larger annotated validation datasets, and using longitudinal imagery to track how landscape management and policy changes affect dumping-prone locations over time are natural next steps for this line of research.
Subject of Research: Unsupervised computer vision analysis of street-level landscapes around frequent illegal dumping monitoring locations in Seoul
Article Title: Exploring street-level landscape patterns around illegal dumping monitoring locations using unsupervised computer vision
Article References: Kim, Y., & Hong, S.-Y. (2026). Exploring street-level landscape patterns around illegal dumping monitoring locations using unsupervised computer vision. Computational Urban Science, 6(1), Article 47. https://doi.org/10.1007/s43762-026-00283-4
Image Credits: AI Generated
DOI: 10.1007/s43762-026-00283-4
Keywords: illegal dumping, computer vision, unsupervised clustering, street-level imagery, Seoul, urban waste management, HDBSCAN, Grad-CAM, landscape classification, VGG-16, t-SNE, manual annotation validation
News Source: Elena Sutton. (November 4, 2026). Unsupervised computer vision maps street landscapes around Seoul’s illegal dumping hotspots. Scienmag.