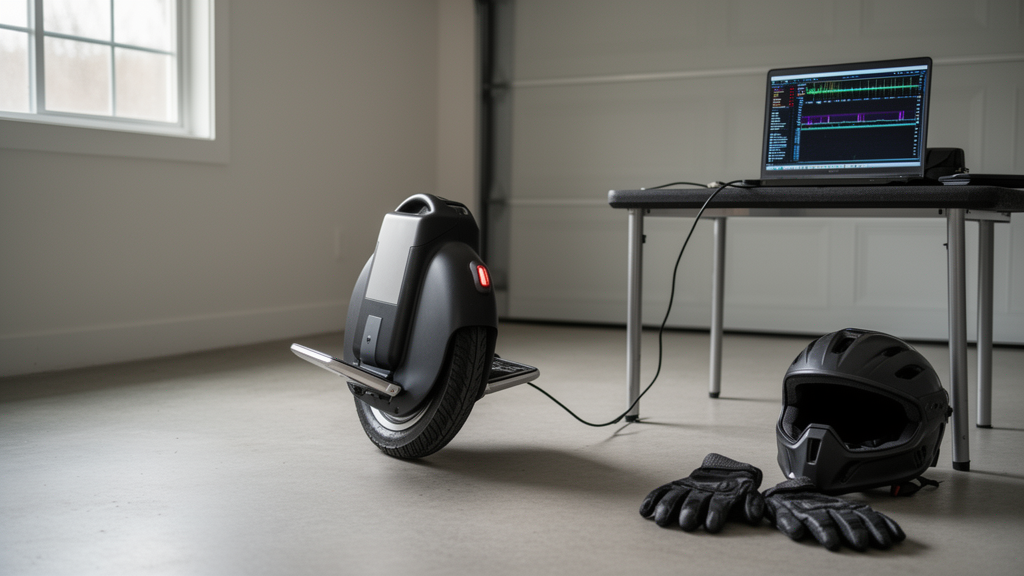
Electric unicycles have quietly grown from novelty gadgets into high-performance personal vehicles capable of carrying commuters at substantial speeds and energies, yet they have remained almost entirely outside the world of formal vehicle health monitoring. A new open-access study introduces EUC_SOH, a monitoring system that turns ordinary ride logs collected by end users into interpretable indicators of battery and power-electronics health, offering a first systematic framework for tracking degradation in these machines over thousands of kilometers of real-world riding.
The motivation is safety. A sudden loss of propulsion on an electric unicycle typically means an immediate loss of balance and a high risk of injury for the rider, and such events are frequently suspected to be linked to electrical or thermal limits in the battery or power stage. Existing mobile applications focus mainly on real-time dashboards and trip logging, without providing long-term, vehicle-level health assessment. Meanwhile, official micromobility safety reports from bodies such as France’s ONISR, the US Consumer Product Safety Commission and the European Transport Safety Council document rising crashes and injuries among micromobility users since 2019, but none isolates electric unicycles as a separate category, and no official dataset systematically separates hardware failures from collisions or loss-of-control incidents.
EUC_SOH, developed by Gauthier Le Bartz Lyan and published in the journal Discover Vehicles, works entirely on data that riders can already access. Companion applications such as EUC World or WheelLog interface with the unicycle’s main controller board, which measures pack voltage and battery current via shunt or Hall-effect sensors, monitors temperatures through onboard thermistors, and broadcasts these measurements over Bluetooth Low Energy at 1 to 10 Hz. Each ride log contains timestamped samples of pack voltage, battery current, vehicle speed and, when available, board and motor temperatures and phase current. The system uses the wheel’s odometer value to position every ride on the vehicle’s lifetime mileage axis.
The core of the method is an indicator called the Equivalent Load Proxy, or ELP. The software first identifies quasi-idle segments where the vehicle is moving slowly or not at all and the battery current is near zero, and estimates a local idle pack voltage from these plateaus. It then focuses on periods of high load, retaining samples above a speed threshold of typically 20 km/h and an adaptive current threshold, and computes the voltage sag as the difference between the local idle voltage and the measured voltage under load. Dividing sag by the absolute current yields the ELP, a system-level quantity that bundles the ohmic contributions of battery cells, busbars, connectors and power devices. The authors deliberately avoid calling it a resistance measurement, because it is inferred under dynamic field conditions rather than controlled laboratory protocols.
To justify this static approximation, the study compared it against a differential method that estimates resistance from sample-to-sample changes in voltage and current across all eight wheels in the dataset, covering 90 rides and roughly 15,800 kilometers. The differential approach failed badly on field data: Pearson and Spearman correlations with the static method were close to zero, the differential estimates were 11.4 times noisier, and 10 to 30 percent of differential samples were negative or exceeded one ohm even after filtering. The authors attribute this to the low sampling rate of 1 to 10 Hz, consumer-grade sensor noise of about plus or minus 0.1 amperes and 0.2 volts, and non-ohmic battery dynamics that violate the assumptions of instantaneous resistance estimation. The static method, by contrast, yielded plausible values in the range of 0.05 to 0.2 ohms for typical packs and stable trends over time.
When information about the power stage is available, EUC_SOH can go further and separate battery and MOSFET contributions. Using the maximum board temperature recorded during a ride as a coarse proxy for junction temperature, along with datasheet values for the on-state resistance of the MOSFET bridge and its temperature coefficient, the system estimates the hot MOSFET resistance and subtracts it from the global median to obtain a battery-dominated resistance, normalized to 25 degrees Celsius with an Arrhenius correction. The authors are careful to stress that this decomposition is approximate: the board sensor reflects the thermal state of the controller PCB rather than individual MOSFET junctions, and the resulting estimates should be read as empirical, within-wheel comparisons rather than precise component-level diagnoses.
Each wheel serves as its own reference. The system computes a mean and standard deviation for each metric from the vehicle’s own history, defines a green band covering one standard deviation, and sets a danger threshold at two standard deviations, with an additional absolute alarm based on a nominal pack resistance estimated from the inferred number of series cells. This adaptive baselining matters because nominal resistance varied widely across wheels, from 0.115 to 0.237 ohms, and usage conditions differ dramatically between riders. In benchmark tests on simulated wheels, a fixed global threshold triggered between 0 and 13 alarms per wheel while missing 127 to 148 alarms detected by the adaptive approach, and an absolute end-of-life threshold triggered no alarms at all during normal operation.
The results span real and synthetic data. In a detailed case study, one wheel monitored from about 400 to 8,300 kilometers showed all resistance-based indicators remaining within or close to their green bands over more than 7,800 kilometers of additional mileage, with no sustained alarms. Yet the final ride on that wheel illustrated why monitoring matters: the rider reported no symptoms whatsoever, but the log sat near the top of the wheel’s historical distribution for electrical stress, with both the 95th-percentile and maximum battery currents exceeding the wheel’s internal danger thresholds and phase-current stress among the highest values observed, even though resistance and sag metrics stayed nominal. The session was significantly more demanding on the power stage than typical rides, without any immediate feedback from the vehicle itself. In synthetic ageing scenarios extending to 30,000 to 35,000 simulated kilometers, the system detected progressive drift in both battery and MOSFET-related indicators, and a one-sided CUSUM change detector provided earlier warning than the statistical threshold in most cases, firing at 10,154 kilometers for one wheel, roughly 1,700 kilometers before the first multi-indicator statistical alarm. A separate synthetic scenario showed the system isolating a single, abrupt out-of-family event near the end of a long trajectory, flagged across multiple metrics even though global statistics remained dominated by the long period of normal operation.
The authors are explicit about what the system does and does not do. EUC_SOH is not a crash-prediction system, and the study does not claim that any specific incident could have been prevented by the proposed monitoring alone. The alarm bands are screening tools rather than safety-certified limits, and exceeding a threshold should prompt further inspection rather than being read as proof that a vehicle is unsafe. The indicators primarily reflect power-capability rather than energy capacity: a wheel whose Equivalent Load Proxy has doubled compared with its early-life baseline may still charge to its nominal voltage but behaves like a power-limited system under load, reaching firmware protection thresholds earlier and with less warning, a scenario the authors connect to brownout risk, where voltage collapse causes reduced torque or cutoff even though the battery is not empty. Limitations include simplified thermal models, user-supplied MOSFET parameters, Gaussian thresholds that may fit skewed distributions poorly, and environmental confounders such as ambient temperature, rider mass and terrain.
The study covers only three real wheels in its detailed case studies, with monitored mileage from about 900 to 7,800 kilometers and 43 ride logs, a small sample of the wider EUC population, though the full eight-wheel dataset spans diverse usage profiles. All data and code are openly available through a Zenodo repository, with brands and identifying information removed. The authors argue that the approach is not EUC-specific: any micromobility platform exposing comparable pack-level telemetry could host a similar monitoring layer, and manufacturers could eventually embed such diagnostics directly in vehicle firmware, aggregating per-ride statistics on board and restricting performance when recent usage exceeded critical limits. They also note that the ride logs analyzed here exist only because independent developers reverse-engineered proprietary Bluetooth protocols, and suggest that manufacturers would benefit from publishing stable interface contracts. For now, the work offers electric unicycle riders something they have never had: a structured, long-term view of what their machine’s own telemetry says about its health.
Subject of Research: Vehicle-level health and usage monitoring of electric unicycles using end-user ride telemetry
Article Title: Vehicle level health and usage monitoring of electric unicycles using end user telemetry
Article References: Le Bartz Lyan, G. (2026). Vehicle level health and usage monitoring of electric unicycles using end user telemetry. Discover Vehicles, 2(1), Article 46. https://doi.org/10.1007/s44465-026-00050-z
Image Credits: AI Generated
DOI: 10.1007/s44465-026-00050-z
Keywords: electric unicycles, EUC_SOH, battery health, Equivalent Load Proxy, voltage sag, MOSFET degradation, health and usage monitoring systems, telemetry, micromobility safety, anomaly detection, CUSUM change detection, state of health
News Source: Denise Maddox. (October 28, 2026). Ride Logs Reveal Hidden Health Warnings in Electric Unicycles. Scienmag.