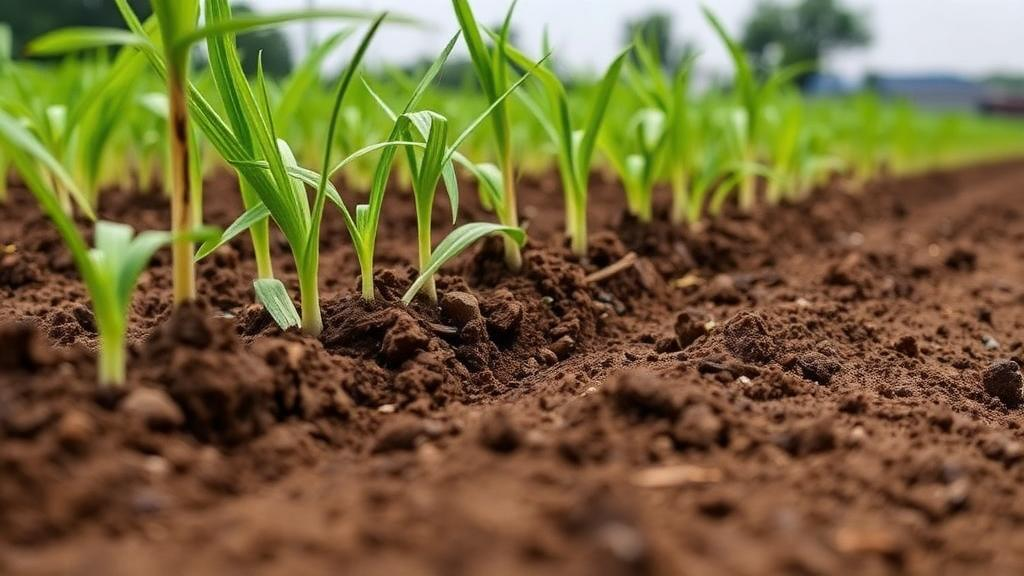
Along a 21-kilometer stretch of the Kali River (East) in Aligarh district, Uttar Pradesh, the fields that feed local villages are being quietly poisoned by the very water that sustains them. For decades, untreated municipal sewage and industrial effluent from sugar mills, paper mills, textile factories, distilleries, and slaughterhouses upstream have flowed into this intermittent tributary of the Yamuna, and farmers have drawn on that tainted water to irrigate sugarcane, wheat, rice, pulses, and oilseeds. A new study published in Discover Soil by Shadab Ali Khan, Abdul Razzaq Khan, and Saif Said of Aligarh Muslim University now offers the most detailed picture yet of what this practice has done to the soil itself, and introduces a fresh statistical tool that could change how scientists track chemical soil degradation worldwide.
The research team collected seventy soil samples from agricultural fields flanking the river during the pre-monsoon season on March 27, 2022, taking each sample from a depth of five to ten centimeters and recording precise GPS coordinates. In the laboratory, the samples were subjected to a battery of nineteen chemical tests using the widely accepted 1:5 soil-to-water extraction method suited to salt-affected soils in arid and semi-arid regions. These tests covered saline-sodic indicators such as pH, total dissolved solids, electrical conductivity, the sodium adsorption ratio, and total hardness; major anions including chloride, nitrate, sulfate, and bicarbonate; major cations including sodium, calcium, magnesium, and potassium; and six heavy metals, lead, nickel, chromium, copper, manganese, and zinc, the latter digested in concentrated nitric acid and quantified by atomic absorption spectrophotometry.
Running nineteen parameters through every assessment would be costly and slow, so the team turned to Principal Component Analysis, a statistical technique that compresses a large dataset into a handful of orthogonal components ranked by the variance they explain. Components with eigenvalues of at least one, each explaining a minimum of five percent of the variance, were retained, and within each component only indicators whose loadings exceeded ten percent of the maximum were kept. Pearson’s correlation analysis then weeded out redundancy, discarding any indicator correlated above 0.7 with a stronger sibling. The result was a Minimum Data Set of just seven parameters: pH, the sodium adsorption ratio, bicarbonate, sulfate, total hardness, manganese, and nickel. Together, five principal components captured seventy-eight percent of the total variance, meaning the team could now describe soil health with a fraction of the original analytical burden.
The descriptive statistics told a nuanced story. Manganese ranged from 165 to 544 milligrams per kilogram with a mean of 312.59, while pH spanned 6.12 to 7.68 with a mean of 7.26, both remaining within permissible thresholds across all sites. Nickel, ranging from 5.9 to 33.5 milligrams per kilogram, stayed below regulatory limits, and sodium adsorption ratio values between 1.07 and 3.65 suggested a relatively low risk of sodicity. Bicarbonate, however, occasionally exceeded its upper allowable limit, and total hardness ranged dramatically from 250 to 1850 milligrams per kilogram, signaling moderate to high hardness with considerable spatial variability. Sulfate concentrations, from 10 to 662 milligrams per kilogram, were interpreted not against toxicity standards but against agronomic sufficiency classes, since sulfate is an essential plant nutrient; the elevated levels largely reflect sulfur enrichment from long-term wastewater irrigation rather than contamination in the toxicological sense.
With the Minimum Data Set in hand, the researchers built twelve competing Soil Quality Indices, or SQIs, each combining the seven indicators in a different way. Three indices used a simple additive framework, averaging indicator scores produced by two linear scoring functions and one nonlinear scoring function, with every indicator first standardized to a value between zero and one according to whether it follows a more-is-better, less-is-better, or optimum response pattern. The remaining nine indices used a weighted additive framework, multiplying each score by a weight reflecting the indicator’s relative importance. Three weighting schemes were compared: the Analytic Hierarchy Process, a pairwise comparison method introduced by Thomas Saaty in which indicators are rated on a one-to-nine importance scale and judged consistent when the consistency ratio stays at or below 0.1, which the team achieved at 0.098; weights derived from the commonality values produced by the PCA; and a newly proposed method the authors call Standard Weight Scoring, or SWS.
The SWS method is the study’s central innovation, and its logic is elegantly simple. Each indicator is first ranked from one to nine according to its documented significance for soil health in the published literature. The reciprocal of that rank is then multiplied by a ratio of the indicator’s lower to upper permissible limits, a quantity that captures how narrow the safe window is for that parameter; a high ratio means little room for error and a greater chance the parameter will stray out of bounds. The resulting products are normalized so their sum equals one, yielding weights that blend expert knowledge, regulatory standards, and statistical reasoning into a single transparent calculation. Where AHP depends on subjective pairwise judgments and PCA depends purely on the variance structure of one local dataset, SWS anchors its weights in external, verifiable benchmarks.
When the twelve indices were compared, the SWS-driven versions stood out decisively. Sensitivity analysis, computed as the ratio of each index’s maximum to its minimum value across the sampling sites, ranked SQI-6, which pairs linear scoring with SWS weights, as the most sensitive index with a value of 4.28, followed by SQI-12, which pairs nonlinear scoring with SWS weights, at 2.71. The remaining indices trailed behind, with SQI-9, built on PCA weights and nonlinear scoring, showing the least sensitivity at 1.41. High sensitivity matters because an index that barely moves cannot detect the subtle seasonal and spatial shifts that signal emerging degradation; the SWS indices responded sharply to variations in salinity stress and environmental conditions during the summer sampling window, while several traditional indices flattened those differences into a monotonous moderate rating.
Geographic Information System mapping using Inverse Distance Weighting interpolation translated the numbers into striking visual patterns. The SQI maps were classified into five categories from very low to very high, and nine of the twelve indices placed between 97.23 and 99.98 percent of the study area in the moderate class, a picture of bland uniformity. SQI-6 told a different and more troubling story: 72.46 percent of the area fell into the low quality class, 27 percent was moderate, and the index spanned four classes from very low to high. The lowest SQI-6 zones clustered along the floodplain and in agricultural sectors immediately adjacent to the river, precisely where seepage and lateral spread of contaminated water would be expected to concentrate their effects. This spatial fingerprint aligns with the pollution sources upstream: on its 120-kilometer polluted reach from Khatauli to Gulaothi, the river receives nearly 589 million liters per day of wastewater, of which roughly 555.61 million liters is untreated sewage and 26.6 million liters is industrial effluent, with the Abu Nala complex near Meerut alone contributing close to 479 million liters daily.
The study’s findings carry implications well beyond one river basin. The authors note that no statistically significant differences emerged between linear and nonlinear scoring in the simple additive framework, suggesting that the simpler linear approach, often dismissed as crude, can perform comparably when the weighting scheme is sound. They also caution that the SWS method, like any index framework, should be validated across diverse ecosystems, soil types, and cropping systems before broad adoption, and that region-specific indices may be needed where climate, vegetation, and land use differ markedly. For policymakers in Aligarh, the SQI maps serve as a practical decision-support layer for identifying high-risk fields that need periodic monitoring, controlled irrigation scheduling, and remediation.
Ultimately, the research delivers a twofold message. First, the soils of the Kali River (East) floodplain bear the cumulative chemical signature of decades of wastewater irrigation, and the degradation is spatially concentrated exactly where the hydrology predicts. Second, the tools we use to measure soil health are not interchangeable; the choice of scoring function and weighting scheme can determine whether a landscape appears uniformly mediocre or reveals pockets of crisis demanding urgent intervention. By combining a statistically derived Minimum Data Set with a transparent, standards-based weighting method, the Aligarh team has offered soil scientists a sharper instrument, and given the communities along the Kali River a clearer map of where the fight for their land must begin.
Subject of Research: Evaluation of soil quality indices for salt-affected agricultural soils irrigated with polluted river water
Article Title: Performance evaluation of soil quality indices in agricultural landscapes
Article References: Khan, S. A., Khan, A. R., & Said, S. (2026). Performance evaluation of soil quality indices in agricultural landscapes. Discover Soil, 3(1), Article 106. https://doi.org/10.1007/s44378-026-00267-0
Image Credits: AI Generated
DOI: 10.1007/s44378-026-00267-0
Keywords: soil quality index, Kali River, wastewater irrigation, Principal Component Analysis, Standard Weight Scoring, Analytic Hierarchy Process, soil salinity, sodicity, heavy metals, GIS mapping, sensitivity analysis, Aligarh
News Source: Alan Morgan. (October 6, 2026). New Soil Scoring Method Reveals Hidden Damage From Polluted River Irrigation. Scienmag.