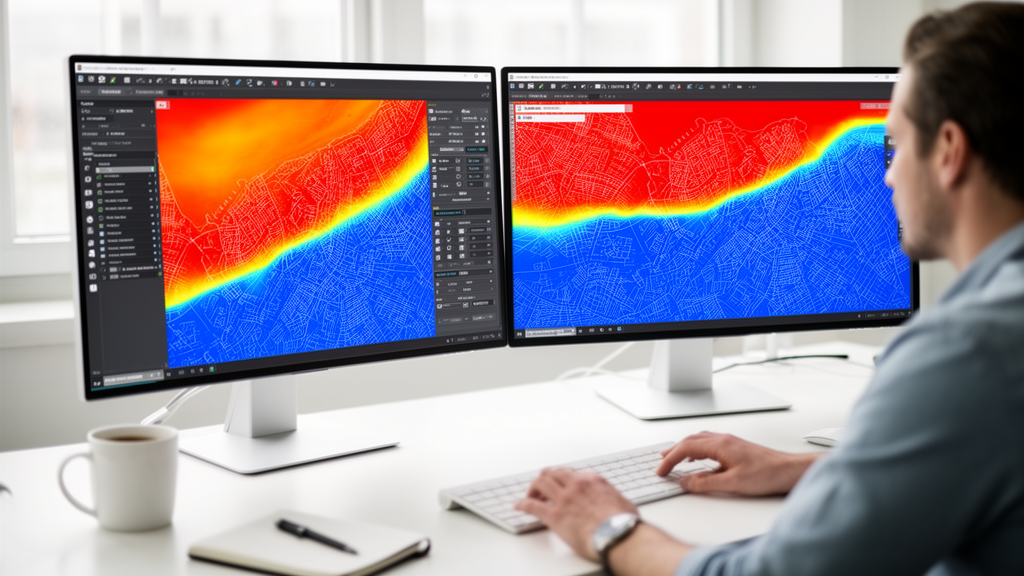
Kernel density estimation, or KDE, is one of those quietly ubiquitous tools in the geospatial world. Ecologists use it to map animal home ranges, urban analysts use it to chart the clustering of hotels and parks, and foresters use it to quantify how road networks slice forests into fragments. The mathematics is elegant: a kernel function counts events within a search radius and weights their influence by distance, producing smooth, continuous surfaces of spatial intensity from raw points or lines. Yet a subtle methodological flaw has long lurked in the standard workflow, and a newly released open-source QGIS plugin, called Iterative Density Analysis, now promises to fix it in a single automated pass.
The problem arises whenever analysts run KDE over large datasets and then clip the results to regions of interest such as municipalities or protected areas. In that conventional workflow, the search radius, known as the bandwidth, is estimated from the global spatial extent of all input features. A bandwidth tuned to an entire nation may be far too broad for a single city district, smearing density peaks into a blur that no longer reflects local reality. Doing it correctly, by computing KDE separately for each polygon, has always been possible in principle but painfully impractical at scale, requiring analysts to manually clip features, estimate bandwidths, run the analysis, export rasters, and mosaic the results for every single region.
That is the gap the Iterative Density Analysis plugin, described in the journal SoftwareX by Miguel Inácio, Luís Valença-Pinto, and Paulo Pereira, sets out to close. Written in Python using the QGIS Python API, or PyQGIS, the plugin treats each polygon in a boundary layer as an independent analytical unit. For every polygon it extracts the geometry, clips the input features to that boundary, estimates or applies a search radius, computes the KDE raster, and clips the output to the polygon edge. Intermediate maps are written to a user-defined directory and then merged into a seamless mosaic, all without a single line of user scripting.
A key design decision was to build the plugin entirely on native QGIS processing algorithms for clipping, rasterisation, and mosaicking. This avoids external dependencies such as SciPy, which can cause version incompatibilities, and means the plugin inherits bug fixes and improvements directly from QGIS itself. The developers tested it on QGIS 3.34 LTR and 3.40 under Windows 11 and macOS, and because only native algorithms are used, it should run on any platform supported by QGIS 3.x, including Linux. The plugin is distributed under the GNU General Public License v3.0 through GitHub and the official QGIS Plugin Repository.
At the heart of the automation lies Silverman’s rule of thumb, a classic statistical formula that estimates an optimal bandwidth from sample size and data spread. ArcGIS Pro applies this rule automatically, but across the global extent of the data, which is precisely the flaw the new tool corrects. The plugin instead applies the bivariate form of the rule, h = 0.9 multiplied by the estimated standard deviation and by n raised to the power of minus one fifth, to the clipped features within each polygon independently. The spread is measured either by the standard deviation or the interquartile range, whichever is smaller after scaling. When a region contains fewer than two features, the plugin falls back to a bandwidth of three times the output cell size, a small but reasonable radius that scales with resolution rather than leaving the calculation undefined.
Line features get special treatment. Because the standard KDE workflow is built around points, the plugin converts lines, such as road networks or hiking trails, into regularly spaced points before density estimation, sampling along each line at one fifth of the cell size so that point spacing stays finer than the output grid. For very dense networks the spacing coarsens automatically to keep runtime and memory manageable. This ensures that line-density outputs are directly comparable with point-density outputs, a consistency that dedicated line-density algorithms do not always guarantee.
The graphical interface walks users through nine intuitive steps, from selecting the feature type and boundary layer to defining cell size, area units, search radius, and output paths. A progress window tracks each polygon’s calculation, and a detailed log is exported at the end, recording the polygon identifier, the number of features, the Silverman bandwidth, and summary statistics such as the median and mean across all regions. This log is not just bookkeeping: it enables a second, comparative mode of analysis, in which the user takes the mean or median Silverman value across all polygons and re-runs the analysis with that value as a fixed, data-driven search radius applied uniformly everywhere.
The illustrative example in the paper is striking. The authors processed 103 administrative polygons across Lithuania, containing 38,058 tourism infrastructure points from OpenStreetMap, at a 10 metre cell size. The complete plugin workflow finished in 80 seconds on a MacBook Pro with an Apple M2 Max chip. The conventional global KDE-then-clip workflow, tested in ArcGIS Pro on the same hardware, took 182 seconds, while a fully manual per-polygon workflow, extrapolated from the largest municipality, would have consumed roughly 51.5 minutes of user time. More importantly, the maps themselves diverge sharply: within Vilnius municipality, the locally estimated workflow reached peak densities of around 190 points per square kilometre, while the globally derived, clipped output peaked at only about 60, despite both using the identical set of input points.
Why does the difference matter so much? A bandwidth estimated from national data smooths density over vast distances, flattening the sharp local peaks that matter to spatial planners and environmental managers. The locally calibrated surfaces produced by the plugin are also better suited as inputs to downstream methods such as Geographically Weighted Regression, where a globally smoothed density clipped to regions would distort local values and, in turn, regression coefficients. Beyond regression, the authors point to applications in ecosystem services mapping, risk and exposure assessment, hotspot analysis, and suitability overlays, wherever the spatial intensity of points or lines must be characterised region by region.
The plugin is not without limitations, which the authors state candidly. It processes polygons sequentially rather than in parallel, which can inflate runtime and disk usage for hundreds of regions at fine resolution. Silverman’s rule becomes less reliable in polygons with very few features, though the log flags these cases. The line-to-point conversion does not exactly reproduce dedicated line-density algorithms, and clipping features to each polygon means that features just outside a boundary, which would contribute density mass under a standard KDE, are excluded, potentially introducing discontinuities at polygon edges. Only the quartic kernel is currently supported. The developers say future work will explore alternative kernels and bandwidth estimators, Linux validation, and native line-density estimation. Even so, the core contribution stands: a free, transparent, one-click workflow that computes density the statistically correct way, region by region, at a scale that was previously impractical.
Subject of Research: Automated per-polygon kernel density estimation with Silverman's rule in a new open-source QGIS plugin
Article Title: Automated kernel density estimation across multiple polygons: the iterative density analysis QGIS plugin
Article References: Inácio, M., Valença-Pinto, L., & Pereira, P. (2026). Automated kernel density estimation across multiple polygons: the iterative density analysis QGIS plugin. SoftwareX, 36, Article 103145. https://doi.org/10.1016/j.softx.2026.103145
Image Credits: AI Generated
DOI: 10.1016/j.softx.2026.103145
Keywords: kernel density estimation, QGIS, GIS, Silverman's rule, bandwidth selection, spatial analysis, open-source software, PyQGIS, mosaicking, tourism infrastructure, Vilnius, geospatial mapping
News Source: Denise Maddox. (October 18, 2026). New QGIS plugin automates region-by-region kernel density mapping. Scienmag.