Researchers in India use GIS mapping to identify city neighborhoods at highest risk of a COVID outbreak–helping officials place targeted restrictions to avoid an economic shutdown
Credit: Study authors
As COVID-19 vaccines slowly roll out across the world, government officials in densely populated countries must still manage vulnerable communities at highest risk of an outbreak.
In a new study published in the Journal Risk Analysis, researchers in India propose a COVID Risk Assessment and Mapping (CRAM) framework that results in a zoned map that officials can use to place more targeted restrictions on high-risk communities. Successfully used by officials in Jaipur at the peak of the pandemic last spring, their framework could help other vulnerable countries avoid a shutdown of their regional economies.
Led by Shruti Kanga, associate professor in the Centre for Climate Change and Water Research at Suresh Gyan Vihar University, the team used satellite remote sensing and Geographic Information Systems (GIS) technology to conduct a spatial risk assessment of the city of Jaipur, located in the state of Rajashthan.
Jaipur had been experiencing a rapid increase in COVID-19 cases since the first cases of the virus were diagnosed in India in January 2020. Due to its high population density, the Jaipur area was subject to extended lockdowns. “It became imperative for the authorities to manage lockdowns without affecting the state’s economy,” the authors write.
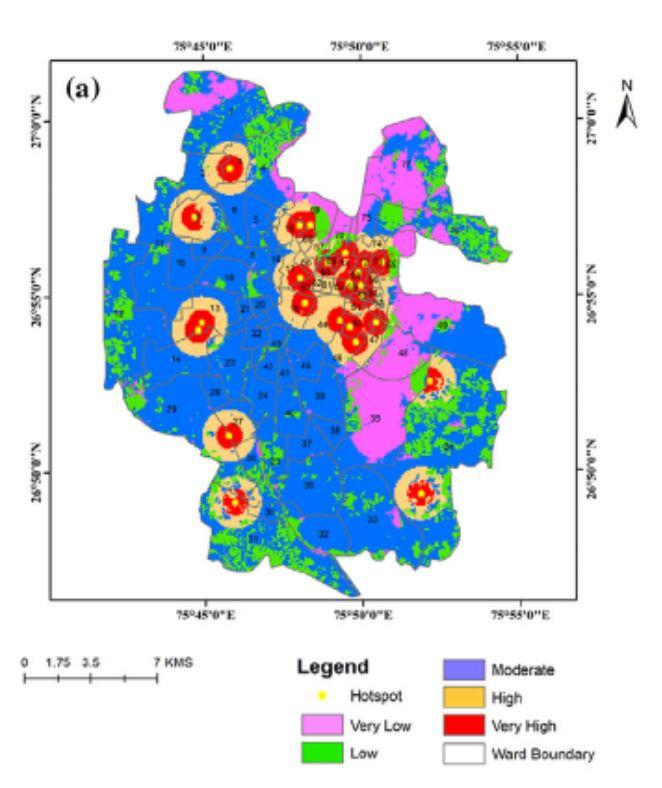
The researchers developed CRAM to provide officials with a vulnerability assessment-based lockdown strategy. Their risk-mapping method involves three steps: 1. Generating GIS layers of administrative, hazard, socio-economic, and bio-physical data. 2. Integrating hazard and vulnerability to generate risk assessment. 3. Risk mapping using an area’s “boundary zones” for prioritizing risk areas and leading to prompt action. The final result is a GIS map of an area with color-coded risk zones delineating the neighborhoods at highest risk of a COVID outbreak.
CRAM generates a risk assessment by integrating hazard and vulnerability components associated with COVID. In the case of Jaipur, this data included these vulnerability risks: total population, population density, and availability of clean water for sanitation. Hazard risks included proximity to COVID “hotspots” (areas with a high density of confirmed positive cases) and land use/land cover–pinpointing high risk settlements and agriculture, where people gather and get exposed to the virus.
Data for each of these factors were used to create a GIS layer for the final map. GIS gives researchers the ability to layer unrelated data points on top of one another to reveal trends via visual maps. “Pandemics are a spatial phenomenon,” says Suraj Kumar Singh, a co-author and professor in the Centre for Sustainable Development at Suresh Gyan Vihar University. “Their spread and lethality can only be understood holistically using GIS tools.”
The researchers established five levels of “risk” zones: red, orange, blue, green, and pink (from highest to lowest risk). The level of risk was determined by multiplying hazard by vulnerability. The resulting color-coded map for Jaipur depicted significant spatial variation — indicating that most areas under high-risk red and orange zones were concentrated along the northeastern and southwestern zones of the study area.
After consulting with authorities managing COVID-19 in the area, the researchers listed specific guidelines for the areas under each risk category. For example, closing shops in red zones; allowing shops to be open three days a week in blue zones; and allowing shops to be open five days a week in green zones. “In Jaipur, our CRAM helped local authorities in deciding which areas to put under lockdown,” says Singh.
Highly populated countries of Asia–India, Bangladesh, and Pakistan– have been especially vulnerable to COVID-19 because of their poverty, population densities, and weak health care systems. Some parts of India are currently experiencing a second wave of COVID-19, including the state of Maharashtra, home to the bustling city of Mumbai. Singh suggests that the CRAM framework could be used in any densely populated area with high-risk communities.
“The CRAM framework can be applied anywhere in the world,” says Singh. “Researchers and decision-makers only need to change the parameters that are specific to that particular geographic region governing COVID-19 or any pandemic.”
###
About SRA
The Society for Risk Analysis is a multidisciplinary, interdisciplinary, scholarly, international society that provides an open forum for all those interested in risk analysis. SRA was established in 1980 and has published Risk Analysis: An International Journal, the leading scholarly journal in the field, continuously since 1981. For more information, visit http://www.
Media Contact
Natalie Judd
[email protected]
Original Source
https:/
Related Journal Article
http://dx.

