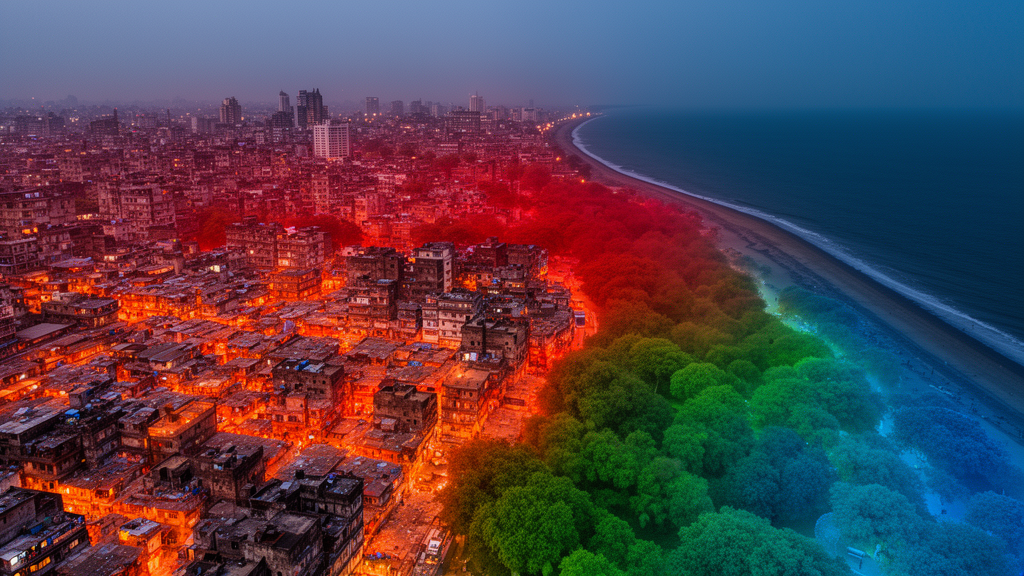
Mumbai’s metropolitan region has grown hotter over the past two decades, and a new open-access study in Computational Urban Science explains why, mapping exactly where each driver of surface urban heat exerts its influence. Using satellite records, machine learning and a novel spatial form of explainable artificial intelligence, researchers traced the intensity of the surface urban heat island (SUHI) across the Mumbai Metropolitan Region (MMR), a 4,548-square-kilometre sprawl of dense cityscape, satellite towns, wetlands, forests and coastline spread over five districts of Maharashtra.
The team retrieved land surface temperature from the thermal bands of Landsat 7 imagery for March–April 2002 and Landsat 8 imagery for the same months in 2014 and 2024, validating the retrievals against MODIS temperature products with a coefficient of determination above 0.80 and a mean temperature difference below 3 °C. Heat island intensity was then calculated as the difference between the temperature of each urban pixel and the average temperature of a surrounding rural buffer extending five kilometres beyond the region’s boundary.
The land-cover record behind the analysis shows how dramatically the region has changed. Built-up area expanded from roughly 780 square kilometres in 2002 to 848 square kilometres in 2024, while cropland shrank from 3,009 to 2,410 square kilometres, with urban growth concentrated on agricultural land at the eastern and northern periphery of Mumbai. Shrubland, often a transitional phase before urbanisation, rose steadily from 275 to 635 square kilometres over the same period.
The thermal consequences are visible in the intensity maps. Areas classified as having very low heat island intensity fell from 13.69 percent of the region in 2002 to 6.31 percent in 2024, while the share of land in the very high intensity category climbed consistently from 8.35 percent in 2002 to 9.87 percent in 2014 and 14.08 percent in 2024. Land surface temperature itself rose by about 2 °C over the study period. The authors note that high and very high intensity zones expanded mostly as contiguous growth around pre-existing hotspots, indicating an intensification of thermal stress rather than a radical reshuffling of where the heat concentrates.
To predict and dissect these patterns, the researchers built four ensemble machine learning models — random forest, gradient boosting, XGBoost and LightGBM — trained on fifteen candidate drivers extracted through Google Earth Engine, including spectral indices for vegetation, moisture, built-up land and bareness, night-time lights, population density, rainfall, air temperature, humidity and pollutant columns for sulphur dioxide, carbon monoxide, nitrogen dioxide, ozone and aerosols. Multi-stage feature selection using Spearman correlation screening and variance inflation factor analysis trimmed the set to fourteen predictors after the moisture index proved almost perfectly inversely correlated with the built-up index.
LightGBM emerged as the strongest performer, achieving a test R² of 0.861 and the lowest test RMSE of 1.494 °C, with XGBoost close behind at 0.856 and 1.52 °C. Crucially, the team used spatial block cross-validation, splitting the region into geographic grid blocks so that training and testing data never overlapped spatially — a safeguard against the optimistic bias that spatial autocorrelation can introduce in urban climate modelling. The spatial cross-validated R² values of 0.767 to 0.780 sit only about 0.06 to 0.09 below the test scores, and bootstrap resampling produced narrow 90 percent confidence intervals around both R² and RMSE, pointing to models that generalise robustly across unseen parts of the map.
The explainability analysis identified a clear hierarchy of drivers. Built-up intensity (NDBI), the bareness index, night-time light intensity and population density acted as the dominant positive drivers of heat island intensity, while the normalised difference water index emerged as the single strongest mitigating factor, its cooling influence reflecting the role of the coastline, creeks, wetlands and lakes such as Vihar, Powai and Tulsi. Vegetation cover, soil moisture, humidity and rainfall also suppressed the heat island effect, whereas air pollutants including carbon monoxide, nitrogen dioxide and aerosols showed moderate positive contributions, with sulphur dioxide, ozone and night-time lights adding smaller but significant boosts.
The study’s principal methodological novelty lies in its spatial extension of explainable AI. Rather than reporting a single global ranking of feature importance, the researchers computed SHAP attributions at individual locations and merged them with geographic data, producing maps that show where each factor pushes temperatures up or pulls them down. Built-up intensity, air temperature and night-time lights exerted their strongest positive influence in densely urbanised and industrial clusters, pollutant effects were localised around industrial zones and traffic corridors, and the cooling influence of vegetation, moisture and water bodies was strongest along the coast and in scattered riparian and green pockets. This heterogeneity, the authors argue, makes the case for location-specific mitigation rather than uniform city-wide interventions.
One striking spatial finding was that all four models predicted higher heat island intensity over transitional peri-urban land than over the densely built urban core, likely because open land and bare surfaces absorb and retain heat readily. The peri-urban fringes, where vegetation is declining and built-up surfaces are fragmenting the landscape, therefore emerge as priority zones for intervention — through urban parks, wetland and lake restoration, mangrove protection, roadside tree cover, permeable surfaces and land-use zoning that restrains sprawl — while dense cores may benefit more from cool roofs, reflective materials and vertical greening.
The authors frame these results against Sustainable Development Goal 11 targets on sustainable urbanisation, resilience to hazards, reduced environmental impact and access to green public space, and they link the intensifying heat to health risks, citing evidence that mortality rises by roughly 2 to 5 percent for each 1 °C increase in temperature, with children and elderly people most affected. They also acknowledge limitations: the SHAP and partial dependence analyses were qualitative within a single modelling framework, and cross-model quantitative comparison of driver relationships remains for future work. Even so, the study demonstrates how pairing machine learning with spatially explicit explanation can turn a black-box temperature prediction into an actionable map of which levers — and where — might cool a rapidly warming metropolis.
Subject of Research: Machine learning and spatial explainable AI analysis of surface urban heat island intensity and its drivers in the Mumbai Metropolitan Region
Article Title: Predicting surface urban heat island intensity and its drivers using machine learning and spatial XAI for achieving SDG-11
Article References: Shahfahad, Talukdar, S., Naikoo, M. W., Raj, H., Poddar, S., Islam, M. R., Rihan, M., & Rahman, A. (2026). Predicting surface urban heat island intensity and its drivers using machine learning and spatial XAI for achieving SDG-11. Computational Urban Science, 6(1), Article 56. https://doi.org/10.1007/s43762-026-00291-4
Image Credits: AI Generated
DOI: 10.1007/s43762-026-00291-4
Keywords: surface urban heat island, Mumbai Metropolitan Region, machine learning, explainable AI, SHAP, LightGBM, land surface temperature, remote sensing, Google Earth Engine, urban heat mitigation, SDG 11, spatial cross-validation
News Source: Teresa Odom. (October 29, 2026). Machine Learning Maps the Drivers of Mumbai’s Growing Urban Heat Islands. Scienmag.