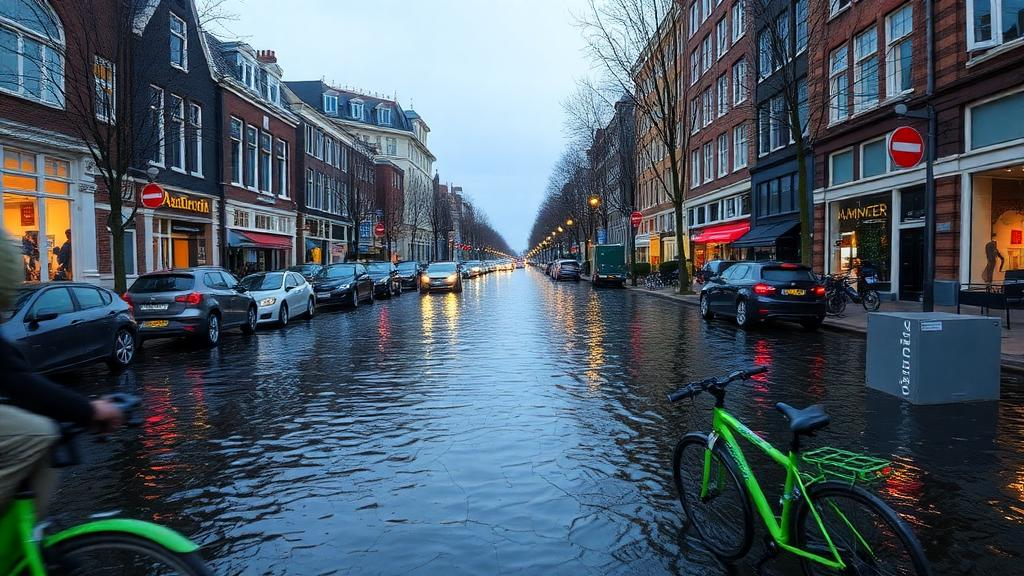
Amsterdam’s celebrated walking and cycling networks, often held up as the gold standard of sustainable urban mobility, face a threat that city planners have largely overlooked: the sea itself. A new modeling study published in Frontiers of Urban and Rural Planning finds that under a high-emissions sea-level rise scenario for 2100, floodwaters could inundate up to 35.64 percent of the city’s active mobility network, severing routes that hundreds of thousands of residents rely on every day. The research, led by Aymeric Olivier Laurent Brouez with Zhen Yuan, Wengin Chung and Chao Liu, is among the first to quantify how rising seas would specifically disrupt pedestrian and cycling infrastructure rather than general road networks.
The team built their analysis around six independent sea-level rise scenarios for 2050 and 2100, combining global projections from the Intergovernmental Panel on Climate Change Sixth Assessment Report with local tide-gauge records from the Netherlands spanning 1840 to 2014. For 2050, the scenarios ranged from a 0.13-meter rise based on local linear regression, treated as the most probable baseline, to a 0.245-meter rise drawn from the median of the high-emission SSP5-8.5 pathway. For 2100, the scenarios extended from 0.22 meters locally to 0.47 meters under SSP1-1.9 and 0.82 meters under SSP5-8.5, the fossil-fueled worst case. The researchers deliberately used median values, meaning their maps likely portray a conservative estimate of future exposure.
To translate those water heights into flooded streets, the study employed an Enhanced Bathtub Model, a refinement of the simple bathtub approach that enforces hydraulic connectivity. Rather than treating every low-lying cell as flooded, the model removes disconnected patches of water that are not hydraulically linked to the sea, correcting a known tendency of simpler methods to overestimate inundation. The team selected an eight-sided connectivity rule, which considers both cardinal and diagonal connections, accepting a slight risk of overestimation as the more prudent choice for crisis assessment. Existing flood defenses, including Amsterdam’s dikes and pumps, were treated as static topographic features within the digital surface model, which was built from LiDAR data with a maximum stochastic error of five centimeters and resampled to ten-meter cells for computation.
The exposure unit itself required a careful definition. Because Amsterdam’s cycling infrastructure is largely woven into its street grid, the researchers operationally defined the active mobility network as all bike-compatible paths, predominantly coinciding with the non-highway urban road network. That amounts to 1,291.2 kilometers of bike-compatible routes, of which 260.6 kilometers are on-road bicycle lanes. The authors acknowledge this simplification aggregates dedicated cycle tracks, on-road lanes and mixed-traffic streets into a single analysis unit, and therefore does not distinguish differences in flood resilience between infrastructure types.
The simulated inundation patterns revealed a stark and consistent center-periphery divide. Across all six scenarios, flooding concentrated in the city’s outer districts, while the historic urban core remained largely unaffected, protected by its topography and the Netherlands’ monumental flood defense systems such as the Delta Works program initiated after the devastating 1953 flood. The progression was also strikingly non-linear: between 0.13 and 0.245 meters of rise, inundated area expanded only gradually, but the 0.82-meter scenario for 2100 marked a decisive step change, with the flooded extent surpassing the cumulative area of all five lower scenarios combined.
That 0.82-meter level emerged as a critical inflection point. Below it, water produces incremental, isolated flooding; above it, water overtops local topographic barriers and artificial defenses, fragmenting the network at multiple scales. At that threshold, the model suggests floodwaters could submerge up to 35.64 percent of the total length of the studied network, meaning more than a third of the city’s walking and cycling routes could be under water. The authors stress that this figure is case-specific rather than a universal threshold, depending on their modeling assumptions, Amsterdam’s low-lying topography and the capacity of its defenses. Cities with weaker flood protection, particularly in the Global South, would likely reach widespread disruption at much lower sea-level rise values.
To assess functional consequences beyond physical inundation, the team turned to space syntax analysis using the open-source DepthmapX software, calculating integration metrics that quantify how easily each street segment can be reached from all others. Because walking and cycling trips are short and spatially bounded, they used local integration at five metric radii, from 400 meters, capturing neighborhood walking trips, to 3,000 meters, covering cross-city cycling commutes. The results mirrored the physical exposure patterns: the historic core maintained stable accessibility across all scenarios, while modern peripheral developments, which currently enjoy higher local integration and better walkability, suffered the steepest declines. Under the 2050 scenarios, accessibility loss remained localized, but the 0.82-meter scenario severed critical peripheral connectors, leaving some neighborhoods unreachable by continuous active mobility routes.
The study also examined whether these losses fall unevenly across social groups, a central question in climate equity research. Aggregating socio-economic data from Amsterdam’s BBGA database to the neighborhood level, the researchers compared accessibility loss against three indicators: registered unemployment among people aged 15 to 65, the share of households with income above the social minimum, and a composite socio-economic status index combining education and income. Neither visual spatial comparison nor Kruskal-Wallis H statistical testing across socio-economic quintiles found a significant relationship. The lowest p-value, 0.058 for the 1,000-meter radius against the composite index, remained above the 0.05 significance threshold. The authors suggest Amsterdam’s long-standing social mixing policies and dispersed social housing may have buffered against environmental injustice, though they frame this as a plausible interpretation rather than a causal conclusion.
The findings carry important caveats. The Enhanced Bathtub Model is static: it does not simulate wave run-up, storm surges or concurrent heavy rainfall, any of which could worsen flooding beyond the projections. The analysis also uses current land use and network data, ignoring future urban development and network expansion through 2100, and it relies on configurational accessibility metrics rather than actual travel behavior surveys. As a single case study of a coastal city with exceptional flood defenses and mature cycling infrastructure, it represents something of a best-case scenario, and the authors call for applying the framework to cities with different climates, infrastructure and socio-economic conditions.
Still, the study exposes a paradox in sustainable mobility planning: walking and cycling networks are promoted worldwide as climate mitigation tools, yet their own climate adaptation remains largely unexamined. To close that gap, the researchers propose three tiered strategies. Protection, using physical barriers and expanded defense programs, suits the historic core and critical nodes; accommodation, including elevated paths, permeable surfaces and saltwater-resistant materials, fits peripheral districts facing moderate 2050 risks; and retreat, relocating infrastructure away from the most flood-prone zones, applies where extreme 2100 impacts make defense unfeasible. The message for coastal cities is sobering: even the world’s most advanced active mobility systems cannot stay viable under rising seas without proactive, spatially targeted adaptation.
Subject of Research: Sea-level rise impacts on the vulnerability and accessibility of Amsterdam's walking and cycling networks
Article Title: Assessing sea-level rise impacts on active mobility: a case study of Amsterdam
Article References: Brouez, A. O. L., Yuan, Z., Chung, W., & Liu, C. (2026). Assessing sea-level rise impacts on active mobility: a case study of Amsterdam. Frontiers of Urban and Rural Planning, 4(1), Article 16. https://doi.org/10.1007/s44243-026-00084-7
Image Credits: AI Generated
DOI: 10.1007/s44243-026-00084-7
Keywords: sea-level rise, Amsterdam, active mobility, cycling infrastructure, flood modeling, space syntax, urban planning, climate adaptation, IPCC AR6, accessibility, coastal cities, socio-economic equity
News Source: Thomas Green. (October 29, 2026). Rising seas could submerge a third of Amsterdam’s cycling network by 2100. Scienmag.