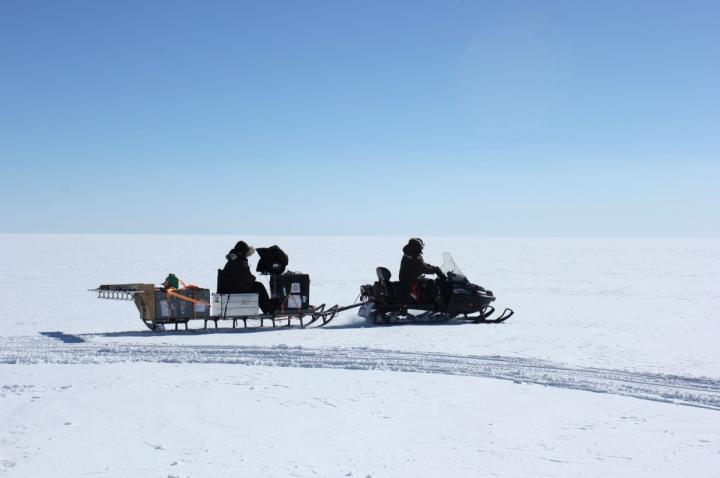
Credit: Christian Panton
New, detailed study of the Renland Ice Cap offers the possibility of modelling other smaller ice caps and glaciers with significantly greater accuracy than hitherto. The study combined airborne radar data to determine the thickness of the ice cap with on-site measurements of the thickness of the ice cap and satellite data. Researchers from the Niels Bohr Institute – University of Copenhagen gathered the data from the ice cap in 2015, and this work has now come to fruition in the form of more exact predictions of local climate conditions.
The accuracy of the study allows for the construction of models for other smaller ice caps and glaciers, affording significantly improved local projections of the condition of glaciers locally, around the globe. The results have recently been published in Journal of Glaciology.
A combination of approaches results in greater accuracy
The initial, principal aim of the study, was to assess the thickness and volume of the Renland Ice Cap, and in the process, validate computer-modelled data against real data. Airborne radar, which measured the thickness of the ice, was compared with measurement results that were known in advance. In addition, researchers availed of satellite-based measurements of the ice velocity on the surface of the ice cap, again juxtaposed with various parameters entered into the computer model, e.g. “basal slide” – in other words, the velocity of movement at the bottom of the ice cap. The combined results provided researchers with an extremely detailed basis material for constructing a computer model that can be applied in other situations.
From Renland to the rest of the world
Iben Koldtoft, PhD student at the Physics of Ice, Climate and Earth section at the Niels Bohr Institute, and first author of the scientific article, explains: “We now have the most optimal parameters for this ice flow model, the Parallet Ice Sheet Model, for the Renland Ice Cap. But despite these being specific local measurements for Renland, we can use these modelling parameters to simulate the ice cap over an entire ice age cycle, for example, and compare the results with the Renland ice core we drilled in 2015. We can examine to what extent the ice cap has changed over time, or how quickly the ice will melt if the temperature rises by a few degrees in the future. Or put more concisely: We now know how the model can be “tuned” to match different climate scenarios. This ensures greater accuracy and a method that is also transferable to other smaller ice caps and glaciers”.
“In fact, we can see that our scientific article initially received many views from Japan and Argentina. At first this was a bit surprising – why there, exactly? But it makes absolute sense. These are countries with smaller local ice sheets and glaciers, who are now excited to be able to project the future evolution of these”, comments Iben Koldtoft.
Smaller scale provides greater visibility
The larger ice sheets in Greenland and Antarctica are of course the most important, when assessing temperature changes and the effects of melting on global climate. However, the smaller ice caps react faster and can be considered as “mini- environments”, where it is possible to follow developments across a shorter timescale. In addition, it is easier to model the smaller scenarios more precisely, points out Iben Koldtoft.
“If we look at Svalbard, an archipelago that lies very far north, they experience climate change as having a far greater local effect than one sees in Greenland, for example. Over time, of course, all these changes will eventually affect the entire climate system, but we can observe it more clearly on a smaller scale”.
The Renland ice core reveals more secrets
In 2015 a core was drilled on the Renland Ice Cap. In the intervening years, scientists have extracted data from the recovered ice core in the form of water isotopes, gases and chemical measurements. These are all proxies for temperature, precipitation accumulation, altitude changes and other climate conditions of east Greenland, where the Renland Ice Cap is located. This data can now be compared with the detailed study and with data from other locations in Greenland. As a result, the study contributes to the increasingly detailed picture of how the climate is changing. Iben Koldtoft emphasises the importance of combining the observational data with computer modelling, and that climate research in general is at a stage where the use of advanced computer simulations and the ability to “tune” them correctly, is now a vital competence. Although glaciers across the globe can be monitored with incredible accuracy by satellites today, there is a need to develop strong computer-based models, combining physics and mathematics, in order to calculate how glaciers will change in the climate of the future, and their effect on future increases in sea levels.
###
Media Contact
Iben Koldtoft
[email protected]
Original Source
https:/
Related Journal Article
http://dx.


