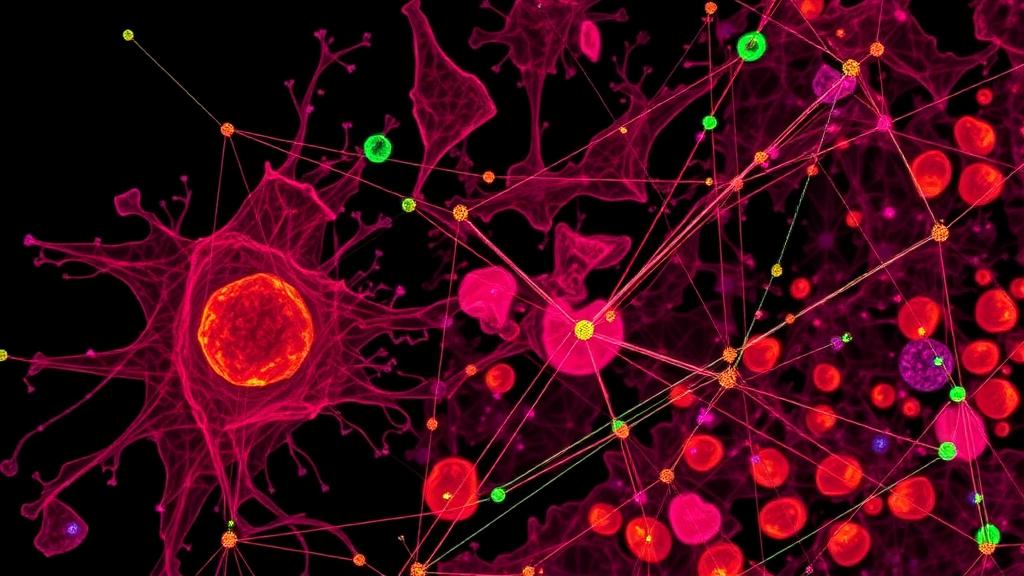
Tissues are not bags of cells. They are ecosystems, arranged in space with a precision that often decides whether a tumour smoulders or spreads. A new open-access study published in Nature Communications introduces SpaCEy, an explainable graph neural network that converts these spatial arrangements into predictions of clinical outcomes, and then shows its work. The tool, developed by a team led by researchers at Heidelberg University together with collaborators in Zurich, Berlin and Ankara, models tissue samples as graphs of individual cells and identifies the exact neighbourhoods of cells and proteins that drive its forecasts of survival and disease progression.
The core idea is deceptively simple. Every tissue image produced by modern spatial proteomics, such as imaging mass cytometry, records the position of each cell and the abundance of dozens of protein markers within it. SpaCEy transforms each sample into a spatial graph using Delaunay triangulation, a geometric method that connects every cell to its nearest spatial neighbours. In this graph, each node is a cell and each node’s features are the measured levels of the protein markers at that location. Critically, the model receives no predefined cell-type labels or anatomical compartment annotations as inputs; it must learn what matters directly from raw molecular measurements and tissue geometry. Clinical annotations are used only afterwards, to help interpret what the model has found.
Once trained, the network compresses each tissue into a compact embedding, a vector that summarises both the molecular states and the spatial relationships of its cells. For survival prediction the model is trained with a censoring-aware loss adapted from the DeepSurv framework, which handles the fact that some patients are still alive at the end of a study and their true survival times are unknown. But prediction alone is where most existing graph-based methods stop. SpaCEy adds an integrated explainer, adapted from the GNNExplainer algorithm, that learns masks over the edges and features of each graph, highlighting the connected subgraphs of cells that contribute most to the prediction. Node importance is computed by aggregating edge importance values within each node’s local neighbourhood, which yields spatially contiguous, compact regions of tissue that the model deems decisive.
Applied to a lung adenocarcinoma cohort of 416 patients profiled by imaging mass cytometry, SpaCEy separated patients who later progressed from those who did not. The regions it flagged told a coherent biological story. Tumours from progressors showed important nodes enriched for FOXP3, a canonical regulatory T-cell marker, and CD163, part of an immunosuppressive macrophage axis previously linked to aggressive lung cancer. Non-progressing tumours instead showed areas rich in helper T cells, cytotoxic T cells and B cells, along with higher expression of HLA-DR and CD4, hallmarks of an active anti-tumour immune response. The model also uncovered a previously undescribed enrichment of CD163-negative macrophages in progression-associated regions, illustrating how its explanations can generate new hypotheses rather than merely confirming known biology.
In head-to-head benchmarking against two state-of-the-art spatially aware methods, SpaCEy came out ahead on the lung cancer progression task. Using fixed, stratified cross-validation folds, it achieved a mean accuracy of 0.68 compared with 0.61 for the method of Ali and colleagues and 0.55 for SPACE-GM, with corresponding advantages in F1-score and area under the ROC curve. Its performance was also the most stable across folds, with peak values reaching 0.77 accuracy and 0.78 AUC in individual runs.
The breast cancer results are where the approach demonstrates its translational ambition. On a dataset of 720 imaging mass cytometry samples from Basel and Zurich, SpaCEy learned embeddings whose clusters separated patients by overall survival with a global log-rank p-value of 0.00253, and it did so independently of the established receptor-based subtypes. One cluster was dominated by low-survival patients and enriched for triple-negative tumours, while another was skewed toward longer survivors with more hormone receptor-positive disease. Within the model-selected important regions, lower-survival samples showed locally elevated abundance of Slug, a driver of epithelial-to-mesenchymal transition, Ki-67, a proliferation marker, c-Myc, an oncogene, and CD3, which in the stromal compartment pointed to an immune-excluded phenotype. About 55 percent of the important regions fell within tumour areas and roughly 29 percent in stroma, showing that outcome-relevant signals span multiple tissue compartments.
The same framework was trained on a second independent breast cancer cohort from the METABRIC imaging study, comprising 460 samples from 405 patients. Once again, embedding clusters separated patients by survival, and the flagged markers overlapped substantially with the first cohort: fibronectin, beta-catenin and vimentin characterised lower-survival regions, while progesterone receptor and HER2-associated signals marked better outcomes. The authors were careful to distinguish generalisable signals from dataset-specific ones, noting, for example, that fibronectin enrichment was not restricted to hormone receptor-positive, HER2-negative patients and should not be read as a standalone universal biomarker. Notably, within the clinically ambiguous HR-positive, HER2-negative subtype, SpaCEy still stratified patients into groups with significantly different survival, addressing one of precision oncology’s most common blind spots.
The quantitative case for spatial information is striking. Against 24 non-spatial baseline configurations built from pseudobulk protein summaries and cell-type compositions, including Fast Survival SVM, Random Survival Forests, Gradient Boosting Survival Analysis and a Cox proportional hazards model, SpaCEy outperformed every variant. On the Zurich and Basel cohort it reached a mean concordance index of 0.720, a 16.5 percent relative improvement over the best baseline; on METABRIC it reached 0.688, a 20.7 percent improvement. A non-spatial neural network trained on the same data failed to produce significant survival separation between its embedding clusters in either cohort, underscoring that the gains come specifically from tissue geometry. In a separate CODEX colorectal cancer cohort, SpaCEy achieved a held-out AUPRC of 0.846 and retained an AUPRC of 0.801 when trained on one tissue microarray batch and tested on another, showing reasonable robustness to technical variation.
The team also stress-tested the method itself. Ablation experiments showed that removing explainer-identified important nodes degraded predictions far more than removing matched unimportant ones. A synthetic tumour-stroma benchmark with known ground truth confirmed that the explainer selectively highlights intended spatial motifs, assigning much higher importance to intratumoural CD8 cells than to identical cells scattered in stroma. Scalability tests indicated the model can process graphs up to a million cells per sample through tiling, with bounded GPU memory. The authors acknowledge limitations: the approach currently captures only protein-marker abundances, explanations inherit the ceiling of predictive performance, and importance scores identify influential features rather than proven causes.
Even with those caveats, SpaCEy signals a shift in how machine learning might enter pathology. Rather than a black box that assigns risk scores, it delivers maps: here are the cells, here are the proteins, here is the patch of tumour that tipped the prediction. That transparency matters for clinical trust, for regulatory scrutiny, and for biologists hunting new mechanisms in the tumour microenvironment. As whole-slide spatial datasets linked to outcomes accumulate, tools that connect tissue architecture to patient fate, and explain themselves while doing so, may become as familiar in the oncology lab as the microscope itself.
Subject of Research: Explainable graph neural networks linking spatial proteomics tissue patterns to clinical outcomes in cancer
Article Title: SpaCEy links spatial tissue patterns to clinical outcomes using explainable graph neural networks
Article References: Rifaioglu, A. S., Ervin, E. H., Sarigun, A., Germen, D., Bodenmiller, B., Tanevski, J., & Saez-Rodriguez, J. (2026). SpaCEy links spatial tissue patterns to clinical outcomes using explainable graph neural networks. Nature Communications, 17(1), Article 10232. https://doi.org/10.1038/s41467-026-77924-z
Image Credits: AI Generated
DOI: 10.1038/s41467-026-77924-z
Keywords: spatial omics, graph neural networks, explainable AI, cancer, tumour microenvironment, survival prediction, spatial proteomics, precision oncology, imaging mass cytometry, patient stratification, machine learning, Nature Communications
News Source: Nathaniel Bowman. (October 10, 2026). AI Reads Tissue Maps to Forecast Cancer Survival, Cell by Cell. Scienmag.