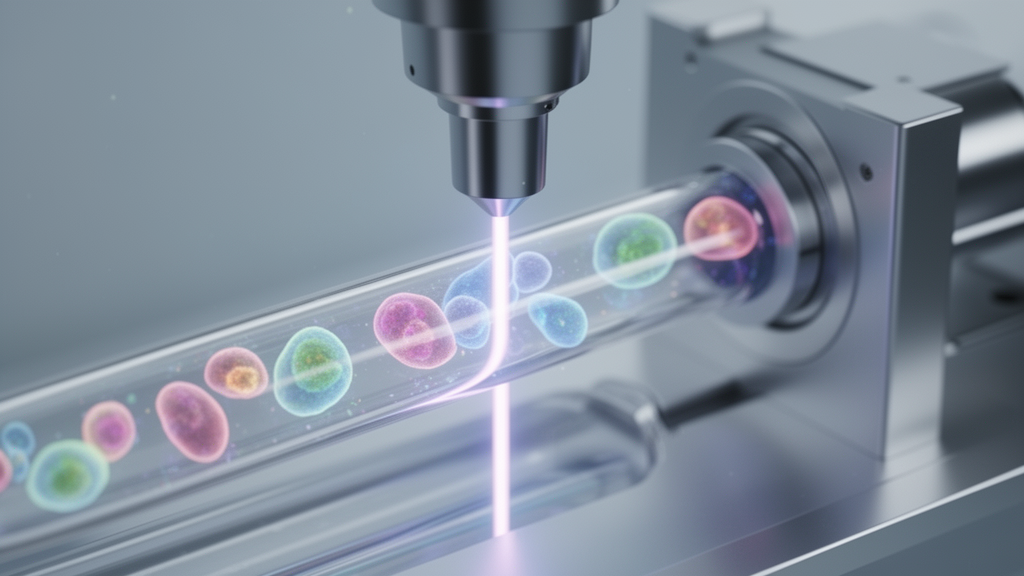
Published in the journal Cancer & Metabolism, the study addresses a critical methodological gap in cancer research by providing simple tools to assess mitophagy, a key quality control mechanism for mitochondria.
Mitophagy is essential for maintaining mitochondrial health by removing damaged organelles, a process that is particularly important in leukemia stem cells. These cells exhibit increased oxidative phosphorylation and heightened sensitivity to mitochondrial damage compared to healthy hematopoietic stem cells. Because mitophagy is necessary for leukemia cell survival, it has emerged as a potential therapeutic target. However, previous methods for measuring mitophagy often required complex genetic approaches, such as the overexpression of fluorescent proteins like mKeima, or indirect measurements that lacked the precision needed for high-throughput screening. The new protocols utilize MitoTracker dyes to directly visualize and quantify mitochondrial dynamics in living cells.
The methodology centers on the use of MitoTracker Green and MitoTracker Orange dyes, which behave differently based on mitochondrial state. MitoTracker Green distributes across all mitochondria, providing a measure of total mitochondrial mass, while MitoTracker Orange is retained only by polarized, functional mitochondria. To measure the rate of mitochondria clearance, the researchers combined MitoTracker Green with CellTrace Violet, a proliferation dye. Since mitochondria are distributed among daughter cells during division, the loss of the green signal over time reflects both cell division and the actual clearance of mitochondria. By monitoring the ratio of MitoTracker Green to CellTrace Violet, the team could isolate the specific contribution of mitophagy to mitochondrial loss.
To ensure the reliability of these measurements, the study incorporated two key improvements. First, the use of the proliferation dye accounts for the dilution of mitochondrial content that occurs naturally during cell division. Second, the protocol includes the addition of reference cells pre-stained with CellTrace Far Red. These reference cells compensate for variable cell densities and viability across different samples, a common challenge in flow cytometry that can introduce significant noise into fluorescence intensity data. This normalization step was crucial for achieving the high reproducibility observed in the study, allowing for accurate comparisons between treated and untreated samples.
The protocols were tested in a panel of 12 leukemia cell lines, including 11 acute myeloid leukemia lines with various TP53 variants and one T-cell acute lymphoid leukemia line, Jurkat. The TP53 gene, a well-known tumor suppressor, was of particular interest because its status can influence cellular responses to stress and apoptosis. The cell lines included those with wild-type TP53, p53-null variants, and specific mutations such as the R248Q hotspot mutation associated with oncogenic gain-of-function. Additionally, the adherent HS-5 cell line, a model of bone marrow stromal cells, was used to validate the protocols in a different cellular context. Western blot analysis confirmed the expected p53 protein levels, with high amounts detected in cells carrying missense mutations and low or absent levels in p53-null lines.
The primary finding of the study was that the rate of mitophagy varied significantly depending on the TP53 status of the cells. Cell lines lacking a functional p53 protein exhibited higher mitophagy rates compared to those with wild-type TP53. This observation aligns with the known pro-apoptotic function of p53, which can suppress mitophagy to allow for the accumulation of damaged mitochondria that trigger cell death. The study used inhibitors such as XRK3F2, which targets the mitophagy receptor SQSTM1/p62, and mDivi-1, which inhibits mitochondrial fission, to measure these rates. The data showed that in p53-null cells, the inhibition of these pathways led to a more pronounced increase in the MitoTracker Green to CellTrace Violet ratio, indicating a higher baseline rate of mitochondrial clearance.
The impact of mitophagy inhibition on mitochondrial mass and polarization was also characterized. Inhibition of mitophagy was generally associated with an increase in total mitochondrial mass, as the removal of damaged mitochondria was blocked. However, the effects on mitochondrial polarization were context-dependent. In cell lines where the inhibitors induced cell death, such as MV4-11 and HL-60 treated with XRK3F2, there was a marked reduction in the amount of polarized mitochondria. Conversely, in cell lines that were resistant to the treatment, such as OCI-AML2 and HEL, mitochondria hyperpolarization was observed, particularly after 48 hours of incubation. This suggests that in resistant cells, the mitochondria may undergo a recovery process or a different adaptive response to the inhibition of mitophagy.
The study also examined the cytotoxicity of the inhibitors used in the protocols. XRK3F2 was found to be more toxic than mDivi-1 and chloroquine, likely because SQSTM1/p62 is involved in other autophagic processes beyond mitophagy. The cytotoxic effects were often preceded by mitochondrial depolarization in sensitive cell lines. Chloroquine, an established autophagy inhibitor, had a limited impact on mitochondria clearance in this assay, possibly because it acts at a late stage of the autophagy process by preventing the fusion of autophagosomes with lysosomes. The method based on the loss of mitochondrial stain may detect earlier stages of mitophagy, or higher doses of chloroquine might be required to effectively inhibit the process in these specific cell lines.
Validation of the protocols in HS-5 stromal cells demonstrated their applicability to adherent cell types. Confocal microscopy images showed that in control cells, the MitoTracker Green signal was localized to the mitochondrial network with minimal overlap with lysosomes. Treatment with the mitophagy inducer CCCP led to a large reduction in the green signal and a loss of mitochondrial organization, confirming the efficacy of the induction. The flow cytometry measurements in these cells were well-reproducible and aligned with the expected effects of the inducers and inhibitors, further supporting the robustness of the developed methods.
The authors note that while the mitophagy rate was variable in cell lines with the R248Q TP53 mutation, the data did not allow for definitive conclusions regarding the specific impact of this mutation on anti-mitophagy functions. The R248Q variant is associated with oncogenic gain-of-function and reduced conformational stability, but the variability in mitophagy rates suggests that other factors may also play a role.
These optimized protocols represent a significant advance in the toolkit available for studying mitochondrial dynamics in cancer. By providing a simple and robust method for measuring mitophagy without the need for genetic modifications, the study facilitates broader investigation into the role of mitophagy in leukemia and other cancers.
The study was published in Cancer & Metabolism, a journal dedicated to the intersection of cancer biology and metabolic processes. The open-access nature of the publication ensures that the protocols and findings are widely available to the research community.
Subject of Research: Development of flow cytometry protocols for measuring mitophagy and mitochondrial mass in leukemia cells
Article Title: Measurement of mitochondria amount and clearance using flow cytometry: effect of mitophagy inhibitors in leukemia cells
Article References: Kořánová, T., Grebeňová, D., & Kuželová, K. (2026). Measurement of mitochondria amount and clearance using flow cytometry: effect of mitophagy inhibitors in leukemia cells. Cancer & Metabolism, 14(1), Article 14. https://doi.org/10.1186/s40170-026-00429-2
Image Credits: AI Generated
DOI: 10.1186/s40170-026-00429-2
Keywords: mitophagy, leukemia, flow cytometry, mitochondria, TP53, cancer metabolism, acute myeloid leukemia, SQSTM1/p62, Measurement, amount, clearance, flow
News Source: Nathaniel Bowman. (November 9, 2026). Flow Cytometry Tracks Mitophagy Variations in Leukemia Cells. Scienmag.