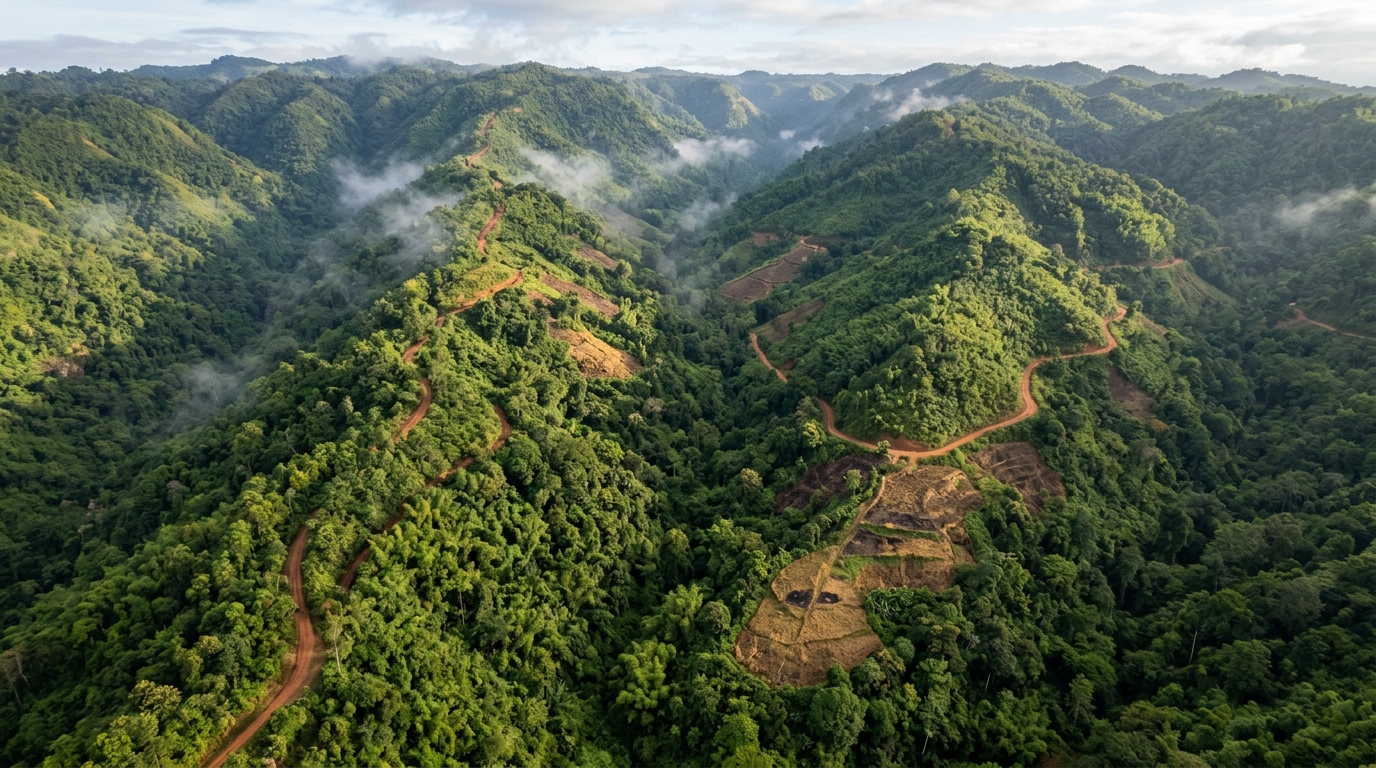
Nearly 41% of Mizoram, the Indian state with the highest proportion of forest cover relative to its total geographical area, now falls into moderate to very high susceptibility categories for forest fragmentation, according to a new remote sensing and GIS based assessment. The study, published in the journal Discover Forests, applied a Weight of Evidence statistical model to satellite imagery spanning two decades and mapped where the state’s forests are most likely to break into smaller, isolated patches. The researchers report that 41.06% of the study area lies in the moderate, high or very high susceptibility zones, with proximity to built-up areas, agricultural land, roads and streams emerging as the strongest spatial predictors of fragmentation.
The research team, led by Apollo Kashyap, Jenny Jeu Brahma, Bistirna Saikia and Dhanjit Deka, generated land use land cover maps of Mizoram for 2005 and 2025 using supervised classification in Google Earth Engine. Landsat-5 Thematic Mapper imagery supplied the 2005 baseline, while Landsat-9 Operational Land Imager 2 data captured the 2025 situation, both at a spatial resolution of 30 metres. The 2005 map achieved an overall accuracy of 72.15%, and the 2025 map reached 77.72%. The authors reclassified these maps into forest and non-forest categories and then processed them with the Landscape Fragmentation Tool version 2.0, developed by the Centre for Land Use Education and Research at the University of Connecticut, to delineate patch, edge, perforated and core forest classes.
The transition statistics reveal a dramatic restructuring of the state’s forest landscape. The patch forest class, which represents small forested areas surrounded by non-forested land, expanded from 899.81 square kilometres in 2005 to 2990.67 square kilometres in 2025, an increase of roughly 332%. Over the same period, the core forest class covering tracts larger than 500 acres contracted sharply from 16,779.69 square kilometres to 8872.07 square kilometres. A single transition dominated this shift: 1893.69 square kilometres of land moved directly from core forest to patch forest, accounting for about 63.31% of the total patch area recorded in 2025. The authors interpret these transitions as evidence of a shift from large contiguous forest tracts toward smaller, more isolated forest classes.
To convert this observed fragmentation history into a forward-looking susceptibility map, the team treated newly formed patch forests between 2005 and 2025 as evidence of fragmentation and modelled where similar conditions recur. The Weight of Evidence method is a bivariate statistical approach grounded in Bayesian probability theory that calculates weights for each influencing factor class based on the presence or absence of forest patches within it. The method rests on the assumption that future fragmentation will occur under conditions similar to those that produced past fragmentation. The researchers randomly selected 70% of the patch locations for model training and reserved the remaining 30% for validation.
Seven causative factors entered the model: altitude, slope, aspect, distance to roads, distance to streams, distance to agricultural land and distance to built-up areas. Topographic variables were derived from the 30 metre Shuttle Radar Topography Mission digital elevation model, road network data came from DIVA GIS, stream networks were extracted from the same digital elevation model, and built-up and agricultural layers were taken from the land use maps. Before modelling, the team ran a multicollinearity analysis using the Variance Inflation Factor and tolerance statistics, because highly correlated input variables can inflate the apparent contribution of individual factors. All seven factors returned VIF values below 5, confirming that they were weakly correlated and suitable for inclusion.
The model computes a positive weight measuring how strongly the presence of a factor class raises the likelihood of fragmentation, and a negative weight reflecting a lower probability of occurrence. The difference between them, the weight contrast, indicates whether a class favours or disfavours fragmentation, and a standardized version of this contrast, adjusted for its variance, feeds into the final Forest Fragmentation Susceptibility Index. Summing the standardized contrasts across all factors and classifying the resulting index with the Jenks Natural Break algorithm in ArcGIS produced five susceptibility classes: very low, low, moderate, high and very high. The very low class occupied the largest share of the state at 38.21% of the total area, while the very high class covered 7.0%.
The spatial pattern of susceptibility follows a clear anthropogenic gradient. Areas lying within 100 metres of built-up areas or agricultural land, on very gentle slopes below 15 degrees, at elevations between 1000 and 3000 metres, proved most prone to fragmentation. Land within 1000 metres of roads and within 500 metres of streams was also susceptible, pointing to the influence of human activity and landscape accessibility on fragmentation patterns. These hotspots clustered mainly in the east, south, southwest and west of the state. Conversely, areas distant from built-up areas, roads and streams, and at elevations below 1000 metres or above 3000 metres, were less prone. Proximity to built-up areas emerged as the single largest contributor among the ranked factors.
Validation with an independent dataset supported the model’s reliability. The researchers converted the reserved 30% of patch pixels into point features, generated an equal number of random points in non-patch areas as absence data, extracted susceptibility index values for all points and constructed a Receiver Operating Characteristic curve in R software. The model achieved an Area Under the Curve value of 0.831, which the authors note exceeds the conventional threshold of 0.8 for good predictive accuracy. An AUC of 0.5 would indicate no discriminatory ability, while 1.0 represents perfect discrimination, placing this model firmly in the good performance range.
The findings align with a broader literature on forest fragmentation drivers in mountainous Asia. Previous analyses have found that forest fragmentation in the Hindu Kush Himalaya region concentrated below 2400 metres, with 85% of total landscape fragmentation occurring within the elevation gradient up to 1500 metres, and that primary broadleaf forests at lower elevations in Sikkim declined by more than 30% while higher elevation forests remained largely undisturbed. In northeast India, higher elevation zones tend to experience minimal forest loss because rugged terrain limits human access. The strong association between agricultural land and fragmentation susceptibility in Mizoram is consistent with the widespread practice of shifting cultivation, locally known as jhum, which previous studies have linked to roughly half of forest fragmentation in Mizoram and Manipur. Road proximity effects also echo earlier work reporting significant forest cover loss within a 10 kilometre buffer of existing road and rail lines in northeast India.
The authors acknowledge limitations that shape how the susceptibility map should be read. The analysis incorporated only seven causative factors and excluded others, including forest fires, shifting cultivation intensity, population pressure and infrastructure development, because consistent spatial datasets for these variables were unavailable. The results are also constrained by the 30 metre spatial resolution of the Landsat imagery and by the accuracy of the land use classification, which ranged from 72.15% to 77.72% overall. Future work, they suggest, could employ higher resolution satellite data, additional environmental and socio-economic variables and advanced machine learning approaches. Even so, the team argues that the generated susceptibility map offers a decision-support framework for policymakers and planners seeking to target conservation interventions in the areas of Mizoram experiencing mounting pressure from agricultural and built-up expansion, and that the methodology can be transferred to other forested regions facing similar fragmentation risks.
Subject of Research: Forest fragmentation susceptibility mapping in Mizoram, India, using a Weight of Evidence model with remote sensing and GIS data
Article Title: Forest fragmentation susceptibility assessment using the weight of evidence model in Mizoram, India
Article References: Kashyap, A., Brahma, J. J., Saikia, B., & Deka, D. (2026). Forest fragmentation susceptibility assessment using the weight of evidence model in Mizoram, India. Discover Forests, 2(1), Article 84. https://doi.org/10.1007/s44415-026-00145-1
Image Credits: AI Generated
DOI: 10.1007/s44415-026-00145-1
Keywords: forest fragmentation, Mizoram, Weight of Evidence model, remote sensing, GIS, Landsat, susceptibility mapping, landscape fragmentation tool, shifting cultivation, ROC validation, northeast India, forest conservation
News Source: Alan Morgan. (November 5, 2026). Nearly 41% of Mizoram’s forests face moderate to very high fragmentation risk. Scienmag.