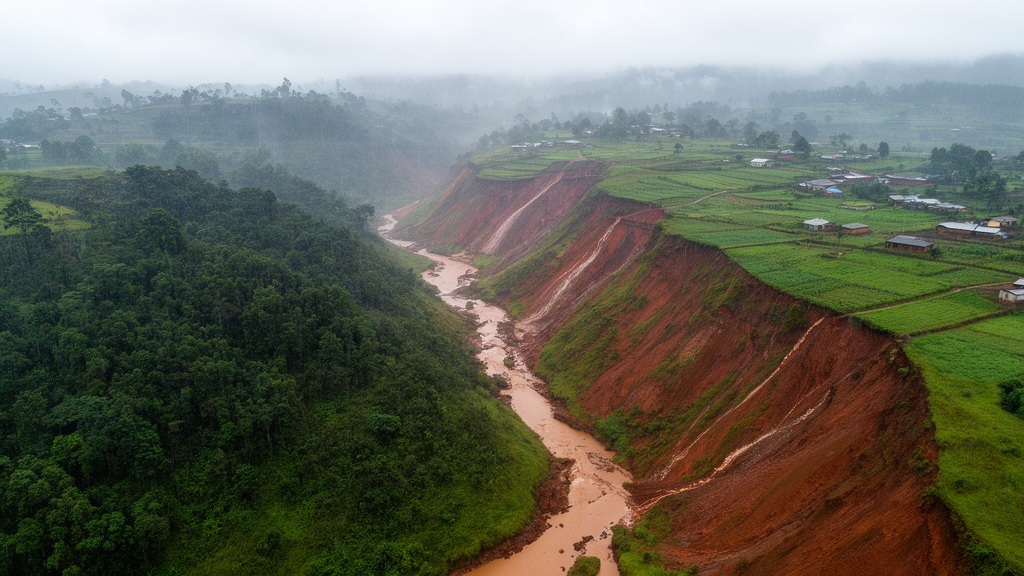
A spatial model of Rwanda’s 3,402-square-kilometre Akanyaru Catchment estimates that annual soil loss ranges from effectively zero to 51.4391 tonnes per hectare, with the greatest modeled losses concentrated in bare, degraded and intensively farmed terrain in the northeastern and southwestern parts of the catchment. The study combined the Revised Universal Soil Loss Equation, or RUSLE, with geographic information systems to produce a 30-metre-resolution erosion surface for forest, agricultural, residential and bare-soil land. Dense forest had the lowest modeled soil-loss contribution, while the most exposed areas combined high rainfall erosivity, erodible soils, steep or long slopes and little vegetation.
The results are model estimates for the catchment, rather than direct measurements of sediment exported from every slope. RUSLE estimates mean annual soil loss as the product of five factors: rainfall erosivity, soil erodibility, slope length, slope steepness, cover and management, and support practices. Rainfall erosivity, denoted R, was derived from 20 years of daily rainfall data in the NASA database and calculated with an empirical equation calibrated for East African highland conditions.
The resulting R values ranged from 527.507 to 888.624 megajoules per millimetre per hectare per hour per year, with the highest values in the eastern and southern catchment and lower values in central and northwestern areas. Station values were distributed across the landscape through inverse-distance weighting in ArcGIS, producing a continuous raster of rainfall erosivity. Soil erodibility, or K, was calculated from global FAO soil-texture and organic-carbon data.
It ranged from 0.239 to 0.688 tonnes per hectare-hour per hectare-megajoule per millimetre, with the highest values generally found in the south and northeast. These light-textured sandy and silty soils with relatively little organic matter were modeled as more susceptible to detachment and transport than clay-rich or organically enriched soils in the central and northwest. The K layer was constructed pixel by pixel with a raster calculator, while a 30-metre digital elevation model supplied the terrain information needed to estimate the combined slope-length and slope-steepness factor.
The study therefore combined regional climate records, global soil information and digital topography rather than relying on a single erosion gauge. The topographic factor, LS, ranged from zero to 1.678. It increased on long, steep slopes, where runoff has more opportunity to gather speed and transport detached particles, particularly in the northeastern and central catchment.
The cover-management factor, C, was derived from Landsat 8 near-infrared and red reflectance through the Normalized Difference Vegetation Index, or NDVI. Values ranged from 0.0004 in dense forest to 0.5237 in bare or degraded areas. This more than 1,300-fold range made vegetation cover one of the model’s most spatially variable controls.
The support-practice factor was fixed at 1.0 because the study found few formal soil-conservation structures in the catchment, so the mapped losses represent conditions without effective terracing, contour farming or comparable erosion-control practices. Multiplying the five raster layers produced the study’s estimated soil-loss range of zero to 51.4391 tonnes per hectare per year. The highest values occurred where the model combined high rainfall erosivity with high C and LS values, rather than in a single uniform zone.
In the northeastern Akanyaru Hills, annual cropland occupied steep, elongated slopes with locally more than 30-degree gradients. C values of roughly 0.25 to 0.52 represented limited protection during land preparation and early crop development, while R values reached the catchment’s upper range. The most degraded slope units in this zone had estimated losses approaching or exceeding 40 to 51.4 tonnes per hectare per year.
The model thus identifies the intersection of intense rainfall, topographic amplification and incomplete vegetation cover as a defining combination in the northeast. A second major hotspot lay in the southwest, where persistently bare and severely degraded land coincided with C values of approximately 0.45 to 0.524 and K values reaching 0.55 to 0.688. In model terms, this zone lacked even the partial canopy protection present in annual cropland, allowing rainfall and runoff to act directly on exposed mineral soil.
The southern forest margin formed a third vulnerable landscape: a shifting mosaic of remnant forest, newly cleared plots and pioneer grassland. Here, R values approached 888 megajoules per millimetre per hectare per hour per year, and clearing abruptly removed the very low C values associated with intact forest. These are spatial model patterns, not a measured time series of erosion before and after forest clearing.
Not every high-loss location depended on the same combination of conditions. Smallholder fields in the Gisagara and Nyaruguru southern uplands sat on moderately sloping terrain, with LS values around 0.5 to 1.0, but underlain by the catchment’s most erodible sandy and silty soils. The study attributed this pattern to depleted organic carbon and weak aggregate stability, showing why land cover alone cannot provide a complete erosion assessment.
In the Bugesera and Cyohoha transitional zone, modeled per-hectare losses were generally lower, often 5 to 20 tonnes per hectare per year, because slopes were gentler. However, drainage networks connected this mixed agricultural and expanding residential landscape to Cyohoha Lake, increasing the potential delivery of detached sediment to wetlands and a transboundary lake system. The distinction between erosion on a slope and sediment delivery downstream is important: the mapped estimate concerns soil loss across the landscape, while the lake connection identifies a pathway of potential transport rather than a measured sediment load.
The study recommends geographically targeted measures because its model identifies different dominant controls in different parts of the catchment. For steep agricultural slopes, it calls for bench terracing, grass and legume waterways and contour practices that interrupt runoff. Bare and degraded southwestern areas require rapid revegetation, including pioneer grasses, shrubs and agroforestry systems, while agricultural intervals with exposed soil could be protected with fast-establishing cover crops.
In the erodible southern uplands, the authors emphasize sustained organic-matter inputs, residue retention, reduced disturbance of soil structure and cross-slope contour bunds. Around Cyohoha Lake, riparian buffers, sediment-retention structures and controls on bare construction surfaces are proposed to reduce downstream sediment connectivity. These are conservation proposals based on the modeled vulnerability patterns; the research did not test their effectiveness in field experiments.
These findings should be read with the model’s limitations in mind. The analysis also relies on interpolated rainfall erosivity, global soil-texture information, satellite-derived vegetation cover and a constant support-practice factor; the accuracy of individual pixel estimates therefore depends on those inputs. The catchment’s different sub-catchments, including the Akanyaru Hills, Akanyaru Valley Left Bank and Akanyaru Cyohoha, also have different topographic and land-cover conditions, so the relative contribution of each factor varies across the landscape.
The 30-metre output provides a common spatial reference for identifying where modeled risk is concentrated, but it does not establish the amount of soil physically measured at a particular farm, nor does it demonstrate that land-cover change alone caused a measured increase in erosion. It offers a detailed baseline for comparing future conservation outcomes and targeting monitoring where steep slopes, exposed soil, erodible materials and intense rainfall overlap.
Subject of Research: Spatial modeling of soil loss across four land-cover types in Rwanda’s Akanyaru Catchment
Article Title: Quantification of soil loss by using RUSLE model under different land use and land cover conditions in AKANYARU catchment in Rwanda
Article References: Ntirenganya, J. B., Bugenimana, E. D., Niyonkuru, R., Iragena, A., Uwamahoro, P. C., Bosco, T. J., & Uwihirwe, J. (2026). Quantification of soil loss by using RUSLE model under different land use and land cover conditions in AKANYARU catchment in Rwanda. Discover Soil, 3(1), Article 191. https://doi.org/10.1007/s44378-026-00347-1
Image Credits: AI Generated
DOI: 10.1007/s44378-026-00347-1
Keywords: soil erosion, RUSLE, Akanyaru Catchment, land cover, rainfall erosivity, soil erodibility, agricultural slopes, GIS, Rwanda, erosion hotspots, Quantification, soil
News Source: Alan Morgan. (October 20, 2026). Research report: Quantification of soil loss by using RUSLE model under different land use and land cover conditions in AKANYARU catchment in Rwanda. Scienmag.