New maths on US infection rates helps identify COVID turning points
Credit: Max Menzies and Nick James
Mathematicians have developed a framework to determine when regions enter and exit COVID-19 infection surge periods, providing a useful tool for public health policymakers to help manage the coronavirus pandemic.
The first published paper on second-surge COVID-19 infections from US states suggests that policymakers should look for demonstrable turning points in data rather than stable or insufficiently declining infection rates before lifting restrictions.
Mathematicians Nick James and Max Menzies have published what they believe is the first analysis of COVID-19 infection rates in US states to identify turning points in data that indicate when surges have started or ended.
The new study by the Australian mathematicians is published today in the journal Chaos, published by the American Institute of Physics.
“In some of the worst performing states, it seems that policymakers have looked for plateauing or slightly declining infection rates. Instead, health officials should look for identifiable local maxima and minima, showing when surges reach their peak and when they are demonstrably over,” said Nick James a PhD student in the School of Mathematics and Statistics at the University of Sydney.
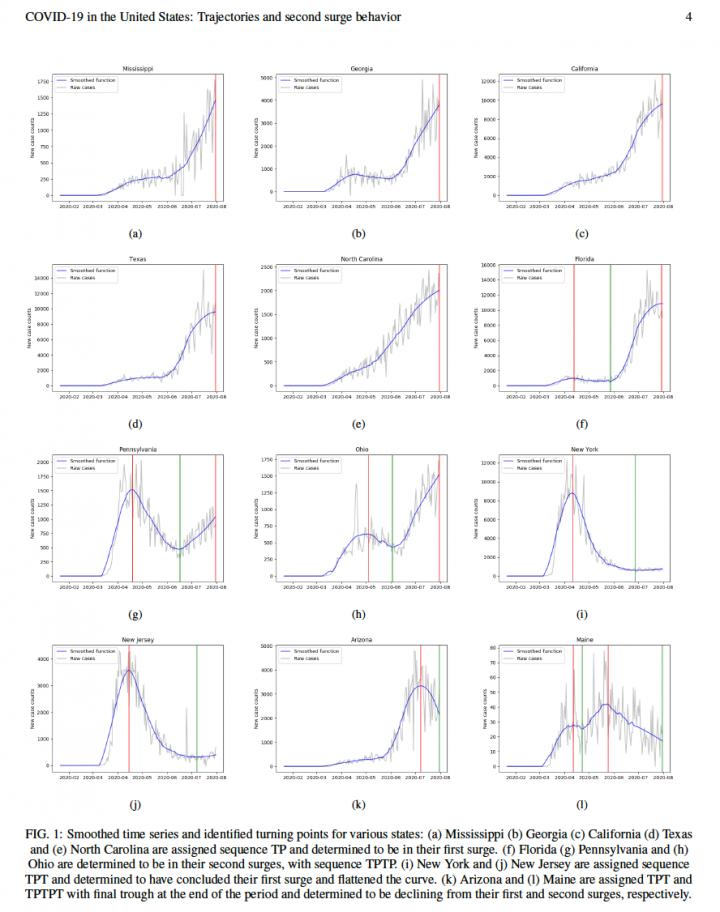
In the study, the two mathematicians report a method to analyse COVID-19 case numbers for evidence of a first or second wave. The authors studied data from all 50 US states plus the District of Columbia for the seven-month period from 21 January to 31 July 2020. They found 31 states and the District of Columbia were experiencing a second wave as of the end of July.
The two mathematicians have also applied the method to analyse infection rates in eight Australian states and territories using data from covidlive.com.au. While the Australian analysis has not been peer-reviewed, it does apply the peer-reviewed methodology. The analysis clearly identified Victoria as an outlier, as expected.
“What the Victorian data shows is that cases are still coming down and the turning point – the local minimum – has not occurred yet,” Dr Menzies said. He said from a mathematical perspective at least, Victoria should “stay the course”.
Dr Menzies, from the Yau Mathematical Sciences Center at Tsinghua University in Beijing, said: “Our approach allows for careful identification of the most and least successful US states at managing COVID-19.”
The results show New York and New Jersey completely flattened their infection curves by the end of July with just a single surge. Thirteen states, including Georgia, California and Texas, have a continuing and rising single infection surge. Thirty-one states had an initial surge followed by declining infection to be followed by a second surge. These states include Florida and Ohio.
Mr James said: “This is not a predictive model. It is an analytical tool that should assist policymakers determining demonstrable turning points in COVID infections.”
METHODOLOGY
The method smoothes raw daily case count data to eliminate artificial low counts over weekends and even some negative numbers that occur when localities correct errors. After smoothing the data, a numerical technique is used to find peaks and troughs. From this, turning points can be identified.
Dr Menzies said their analysis shows governments should try not to allow new cases to increase, nor reduce restrictions when case numbers have merely flattened.
“A true turning point, where new cases are legitimately in downturn and not just exhibiting stable fluctuations, should be observed before relaxing any restrictions.”
He said that the analysis wasn’t just nice mathematics, using a new measure between sets of turning points, the study also deals with a very topical problem: looking at state-by-state data.
Mr James said that aggressively pushing infection rates down to a minimum seemed the best way to defeat a second surge.
PEAKS AND TROUGHS
To determine the peaks and troughs, the algorithm developed by the mathematicians determines that a turning point occurs when a falling curve surges upward or a rising curve turns downward. Only those sequences where the peak and trough amplitudes differ by a definite minimum amount are counted. Fluctuations can occur when a curve flattens for a while but continues to increase without going through a true downturn, so the method eliminates these false counts.
Both from Australia, the two mathematicians have been best friends for 25 years. “But this year is the first time we have worked on problems together,” Mr James said.
Mr James has a background in statistics and has worked for start-ups and hedge funds in Texas, Sydney, San Francisco and New York City. Dr Menzies is a pure mathematician, completing his PhD at Harvard in 2019 and his undergraduate mathematics at the University of Cambridge.
###
DOWNLOAD graphs and the research at this link.
INTERVIEWS
Nick James | School of Mathematics & Statistics | The University of Sydney
[email protected] | +61 433 952 207
Max Menzies | Yau Mathematical Sciences Center | Tsinghua University
[email protected] | +1 (617) 545 4649 (WhatsApp)
MEDIA ENQUIRIES
Marcus Strom | Media adviser | The University of Sydney
[email protected] | +61 423 982 485
DECLARATION
The authors received no external funding for this research.
Media Contact
Marcus Strom
[email protected]
Related Journal Article
http://dx.
