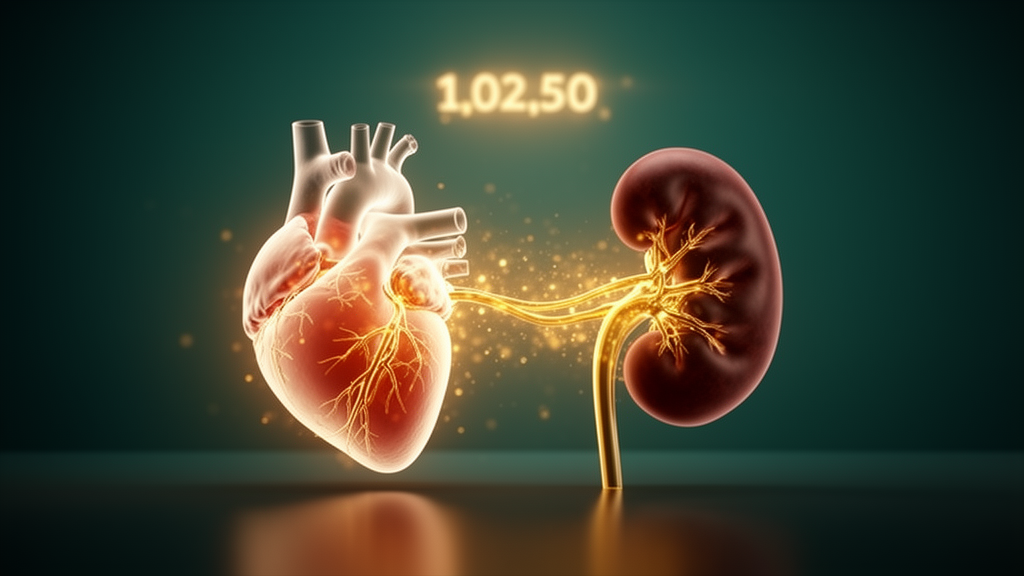
A simple calculation that blends blood fats, blood sugar and waist-based estimates of visceral fat has emerged as the strongest predictor, among ten closely related indices, of who will develop advanced cardiovascular-kidney-metabolic syndrome within five years. In a prospective community-based cohort study conducted in Yulin, in China’s Guangxi region, researchers followed 2,072 adults who were free of advanced disease at the start and found that the triglyceride-glucose-Chinese visceral adiposity index, known as TyG-CVAI, consistently outperformed its rivals. The work, published in Cardiovascular Diabetology, combined classical epidemiological regression with an array of machine learning algorithms to settle a question that had not previously been systematically compared: which of the many TyG-derived indices carries the most predictive weight for this newly defined syndrome.
The cardiovascular-kidney-metabolic syndrome, abbreviated CKM, is a recently proposed integrated disease concept that recognises how metabolic disturbances, kidney dysfunction and cardiovascular disease reinforce one another. Its advanced stages, Stage 3 and Stage 4, are characterised by subclinical or clinical cardiovascular disease, severe chronic kidney disease, and significantly elevated mortality risk. The triglyceride-glucose index and its many derivatives were attractive candidates because they can be computed from routine measurements and are thought to capture both insulin resistance and obesity in a single number.
The ten indices evaluated in the study were TyG itself and nine variants that multiply or combine the base index with anthropometric markers: TyG-WC, which uses waist circumference; TyG-WHtR, which uses waist-to-height ratio; TyG-BMI; TyG-BRI, the body roundness index; TyG-WWI, a weight-adjusted waist index; TyG-LAP, the lipid accumulation product; TyG-ABSI, the a body shape index; TyG-VAI, the visceral adiposity index; and TyG-CVAI, the Chinese visceral adiposity index. Each variant attempts to sharpen the base index by folding in a different way of estimating where and how much fat a person carries. Until now, their relative performance in predicting advanced CKM syndrome had not been systematically compared.
The study population came from a single community in Yulin, Guangxi, and comprised 2,072 participants who had no advanced CKM syndrome at baseline. They were followed for a median of 54.7 months, close to the five-year horizon the investigators targeted. During that period, 247 participants developed incident advanced CKM events, corresponding to an incidence density of 2.79 per 100 person-years. Ten TyG and TyG-derived indices were calculated for every participant at baseline, and the analysis then asked which of them best discriminated between those who did and did not progress to advanced disease.
The analytical plan was unusually thorough. Restricted cubic spline regression was used to assess dose-response relationships between each index and disease risk, while Cox proportional hazards regression estimated effect sizes. Because a single statistical technique can mislead, the team evaluated incremental predictive value against two benchmarks: a clinical reference model and a simplified model used in sensitivity analyses. The primary metrics were the integrated discrimination improvement, or IDI, and time-dependent area under the curve, with net reclassification improvement, or NRI, as a secondary measure, all supported by 1,000 bootstrap resamples. Multiple comparison corrections using both false discovery rate and Bonferroni procedures were applied, and subgroup analyses checked whether the associations held across strata of age, gender, smoking, drinking and exercise.
The dose-response results showed that, with one exception, higher values of these indices tracked with higher risk in a straightforward linear fashion. TyG-ABSI was the outlier, exhibiting a U-shaped non-linear association with a statistically significant nonlinearity term (P for nonlinearity = 0.037) and crossing points at 0.651 and 0.712. The remaining nine indices all showed significant linear dose-response relationships with advanced CKM risk, with overall P values below 0.05 and nonlinearity P values above 0.05. In the fully adjusted model, TyG-CVAI demonstrated the largest effect size: each one-standard-deviation increase carried a hazard ratio of 1.290, with a 95 percent confidence interval of 1.143 to 1.456 and a P value below 0.001.
The incremental value analyses added nuance rather than drama. Using the clinical reference model, TyG-CVAI produced the highest continuous NRI of any index, at 0.363 (95 percent CI 0.198 to 0.493, P < 0.001), but its IDI was modest at 0.009 (95 percent CI 0.001 to 0.022, P = 0.016). At the 60-month mark, adding TyG-CVAI to the model raised the AUC from 0.789 to 0.799, a change of 0.010 that was statistically significant (P < 0.001) yet small in absolute terms. This was nonetheless the largest improvement among all ten indices. The authors themselves note in their conclusions that although TyG-CVAI showed the largest effect size and highest continuous NRI, its incremental value beyond established clinical predictors was modest, an honest framing that distinguishes statistical signal from clinical leap.
Machine learning formed the second pillar of the study. Three feature selection methods, LASSO, Boruta and random forest recursive feature elimination, were jointly applied within a training set to identify the optimal TyG index, and all three consistently singled out TyG-CVAI. Its stability was striking: the index was selected in 100 percent of 1,000 bootstrap resamples. Six algorithms, random forest, XGBoost, LightGBM, a multilayer perceptron, AdaBoost and bagging, were then used to construct prediction models, and the final choice was made on test-set discrimination, calibration judged by a Hosmer-Lemeshow P value of at least 0.05, and clinical utility. The XGBoost model won, achieving a test-set AUC of 0.839 (95 percent CI 0.796 to 0.883), a Brier score of 0.084 and a Hosmer-Lemeshow P value of 0.200, which the investigators judged the best balance between discrimination and calibration.
Internal validation and interpretation analyses reinforced the picture. Ten-fold cross-validation yielded an AUC of 0.855 plus or minus 0.038, and bootstrap optimism correction with 1,000 resamples produced an optimism-corrected AUC of 0.870, indicating a low risk of overfitting. Decision curve analysis showed positive net benefit compared with a treat-all strategy across threshold probabilities from 0.10 to 0.40, and calibration curves showed good agreement between predicted and observed outcomes. SHAP analysis of the final six-feature model illustrated the contributions of age, gender, hypertension, diabetes, LDL cholesterol and TyG-CVAI. Perhaps most striking for readers thinking in absolute terms: using a cutoff of 0.14 derived from the training set, the test set split into low- and high-risk groups whose five-year cumulative incidences of advanced CKM were 5.9 percent versus 38.1 percent, a hazard ratio of 8.356 (95 percent CI 5.105 to 13.676, P < 0.001).
Robustness checks were extensive. Sensitivity analyses included inverse probability of censoring weighting, exclusion of participants with hypertension, diabetes or medication use, additional adjustment for baseline CKM stage, separate analyses for Stage 3 and Stage 4 outcomes, and a redefinition of advanced CKM that excluded Stage 3 events defined solely by an estimated glomerular filtration rate below 30 mL/min/1.73 m2. All yielded consistent results, and the findings survived both FDR and Bonferroni correction, with subgroup analyses showing consistent associations across every stratum examined (all P for interaction above 0.05). The authors conclude that TyG-CVAI may serve as a low-cost auxiliary tool for identifying individuals at high risk of advanced CKM in community settings, but they attach an explicit caveat: the result awaits external validation. This was a single-community cohort in one Chinese region, and the version of the article shared ahead of final publication is subject to further edits. For now, the message is that a cheap laboratory calculation, sharpened by the right statistical machinery, can sort a community into markedly different risk tiers, even if the clinical payoff of that extra sorting power remains, by the authors’ own accounting, modest.
Subject of Research: Predictive performance of triglyceride-glucose-derived indices for advanced cardiovascular-kidney-metabolic syndrome in a Chinese community cohort
Article Title: Triglyceride-glucose-Chinese visceral adiposity index (TyG-CVAI) outperforms other TyG-derived indices in predicting 5-year advanced cardiovascular-kidney-metabolic syndrome: a prospective community-based cohort and machine learning study in China
Article References: Wu, Y., Wei, Q., Ye, L., Mo, Y., Wei, Y., Fang, F., Wei, H., Zhang, Q., Li, M., & Mo, Z. (2026). Triglyceride-glucose-Chinese visceral adiposity index (TyG-CVAI) outperforms other TyG-derived indices in predicting 5-year advanced cardiovascular-kidney-metabolic syndrome: a prospective community-based cohort and machine learning study in China. Cardiovascular Diabetology. https://doi.org/10.1186/s12933-026-03383-x
Image Credits: AI Generated
DOI: 10.1186/s12933-026-03383-x
Keywords: TyG-CVAI, cardiovascular-kidney-metabolic syndrome, insulin resistance, visceral adiposity, machine learning, XGBoost, cohort study, risk prediction, community health, China, epidemiology, biomarkers
News Source: Phoebe Ingram. (October 30, 2026). TyG-CVAI Index Tops Rivals in Predicting Advanced Kidney-Heart-Metabolic Disease. Scienmag.