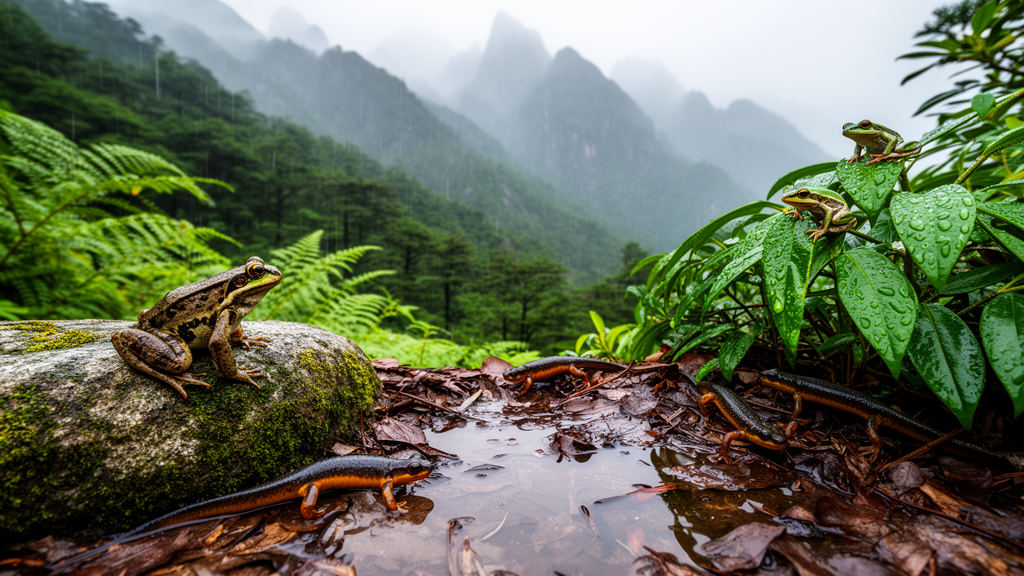
An observational field study of amphibians across the Huangshan Mountains in southern Anhui, China, found that wetter and more vegetated sites were associated with richer local communities, while climatic and geographic gradients coincided with extensive differences in species composition among sampling sites. The study covered 200 5-by-5-kilometre grids during spring and autumn of 2023 and 2024, recording 10,342 individuals from 23 species. Local alpha diversity was associated most consistently with annual precipitation and the Normalized Difference Vegetation Index, an indicator of vegetation productivity. Across the landscape, 97.86% of beta diversity reflected species turnover rather than nestedness, indicating that amphibians replaced one another as conditions varied rather than forming uniformly poorer subsets of a single rich assemblage. Latitude and annual precipitation were the only significant predictors of community dissimilarity after spatial structure and other environmental variables were considered.
The researchers established 200 fixed survey grids across an approximately 5,500-square-kilometre region at the boundary of the Palaearctic and Oriental zoogeographic realms. Each grid contained one 200-metre transect, positioned close to a stream or pond because amphibian detection and reproduction are closely associated with aquatic habitats. The same transects were surveyed in April–May and September–October of both years, with nighttime fieldwork timed to coincide with the nocturnal activity of most local species. Teams of two observers and one recorder walked each transect at 2–3 kilometres per hour, identifying animals visually and by their calls. Individuals that could not be identified reliably were sampled non-lethally and identified through laboratory DNA barcoding. For every encounter, the team recorded the species, number of individuals, geographic coordinates and elevation.
The effort yielded 23 species from 20 genera, nine families and two orders. Ranidae was the most species-rich family, contributing nine species, or 39.13% of the total; Dicroglossidae contributed four species, or 17.39%. Microhylidae, Rhacophoridae and Salamandridae each contained two species, while Bufonidae, Megophryidae, Hylidae and Cryptobranchidae were represented by one species each. The dominant species were Fejervarya multistriata, with a Berger–Parker dominance index of 0.43, Microhyla fissipes at 0.18 and Bufo gargarizans at 0.14. The survey also detected Hoplobatrachus chinensis and Andrias davidianus, both listed as nationally protected Class II species.
A Chao2 estimator placed total expected richness at 23.995 species, with a standard error of 2.299 and a 95% confidence interval of 23.069–37.273. Observed richness therefore represented 95.85% of the estimate, and species-accumulation curves approached an asymptote in both survey years, indicating that the sampling captured most of the regional species pool. This estimate is consistent with the survey’s broad spatial coverage, although it does not eliminate the possibility that some species were missed during particular seasons. The effort involved 800 transect surveys in total, because all 200 fixed locations were visited during each of four survey periods. Repeating the same locations helped reduce false absences and make temporal comparisons possible, while the consistent transect length and team protocol maintained comparable sampling effort across sites and periods.
Local diversity varied more between seasons than between years. In both 2023 and 2024, spring values were significantly higher than autumn values for the Shannon–Wiener index, Simpson index, Pielou evenness, Berger–Parker dominance and species richness. The combined-year comparison also showed significant seasonal differences for the Shannon–Wiener, Simpson, Pielou, dominance and relative-abundance measures, although not for species richness. By contrast, paired Wilcoxon signed-rank tests found no significant interannual difference for the Shannon–Wiener index, Simpson index, evenness, dominance or relative abundance. Species richness did differ between 2023 and 2024, but its median was four species in both years, indicating that the statistical difference arose from the distribution of paired site-level changes rather than a shift in the central value. The two-year record therefore suggests short-term stability in most measures, but it cannot establish a long-term trend or a direction of change.
For the environmental analyses, the researchers initially considered annual precipitation, mean annual temperature, elevation, aspect, slope, NDVI, distance to the nearest major river and the Human Footprint Index. Pairwise Spearman correlations were used to identify strong collinearity, and variables with absolute correlation coefficients above 0.8 were removed in favour of factors with clearer biological interpretation. Six predictors remained: annual precipitation, NDVI, slope, aspect, distance to river and the Human Footprint Index. Values were extracted at the midpoints of the 200 sampling grids from source layers with native resolutions ranging from 30 metres to approximately one kilometre. Because the analysis used point extraction rather than raster overlay or cell aggregation, no resampling was performed, an approach intended to avoid artificial values created during interpolation. This design also meant that the environmental estimates represented broad conditions at grid midpoints rather than every habitat surrounding an amphibian encounter.
Simple correlations showed that the Shannon–Wiener index, Simpson index and species richness were positively associated with annual precipitation, NDVI, slope and distance from a river, and negatively associated with the Human Footprint Index. No alpha-diversity metric had a significant correlation with aspect. Generalized additive models, checked for variance inflation and selected using the corrected Akaike information criterion, sharpened these patterns. Annual precipitation was positively and significantly related to all three alpha-diversity measures, each with p-values below 0.001 and a model weight of 1.0. NDVI was also significant for all three measures, with model weights of 1.0 for Shannon diversity and richness and 0.900 for Simpson diversity. The Human Footprint Index had a significant negative relationship with species richness at p = 0.035, but its relationships with Shannon and Simpson diversity were not significant. Slope and distance to river received lower model weights and had non-significant model-averaged coefficients.
Community composition differed sharply across the 200 transects. Mean pairwise Sørensen dissimilarity was 0.981. Partitioning this total dissimilarity produced a turnover component of 0.960, accounting for 97.86%, and a nestedness component of 0.021, accounting for 2.14%. The result means that changes in species composition were overwhelmingly associated with replacement: sites with different assemblages generally contained different sets of species, rather than being species-poor versions of a common regional pool. This pattern is consistent with environmental sorting across Huangshan’s pronounced gradients in moisture, productivity and topography, but the observational findings do not establish a specific causal mechanism. The measured pattern shows that nested species loss was a minor component of spatial differences among the surveyed communities.
Distance-based redundancy analysis was used to estimate how six environmental predictors and spatial trends were associated with multivariate community patterns. The overall model was significant, with F = 2.06, p = 0.0001 and an adjusted R-squared of 4.1%, but individual effects were concentrated in two predictors. Annual precipitation had a marginal contribution of 1.797 and latitude a contribution of 1.337; both were significant at p = 0.0001. Longitude contributed 0.63%, NDVI 0.49%, distance to river 0.71%, the Human Footprint Index 0.48%, aspect 0.42% and slope 0.29%, with none of these remaining effects significant. Forward selection found only the first constrained-axis result significant, with CAP1 yielding F = 9.4219 and p = 0.0001; CAP2 through CAP8 were not significant. Residuals showed no detectable spatial autocorrelation, with Moran’s I = 0.0074 and p = 0.771, indicating that the spatial terms adequately addressed the measured structure. Thus, precipitation was associated with both local diversity and broad compositional change, whereas NDVI had a strong relationship with local diversity but was not a significant independent predictor of beta diversity in the final multivariate model. The relatively low adjusted R-squared also shows that the measured environmental and spatial terms accounted for only a limited share of beta-diversity variation after adjustment.
Several limitations constrain the interpretation of this two-year landscape snapshot. Surveys occurred only in spring and autumn, leaving the summer breeding period unsampled, and nocturnal fieldwork may have missed diurnal or crepuscular species. Environmental values were extracted at grid midpoints, potentially masking local features such as temporary ponds, and one 200-metre transect per 5-by-5-kilometre grid may not capture within-grid heterogeneity. Transects were deliberately located near water to improve detection, but that placement also means the design does not represent every habitat equally. The study’s broad coverage and high estimated sampling completeness support regional comparisons, yet additional seasons, repeated microhabitat sampling and denser transect replication would be needed to test fine-scale relationships and determine whether the observed patterns persist under climate change. Within those bounds, the evidence identifies precipitation and latitude as the main correlates of community turnover, and vegetation productivity as a major correlate of local diversity across the Huangshan Mountains.
Subject of Research: Environmental correlates of amphibian alpha and beta diversity across the Huangshan Mountains
Article Title: Patterns and Environmental Drivers of Amphibian Alpha and Beta Diversity in the Huangshan Mountains, Southern Anhui, China
Article References: Wang, S., Wang, Z., Sun, Y., He, Z., Sun, Q., Wei, J., Li, Y., Liu, M., Shi, J., Zhang, C., Wu, S., Bai, Y., Zhang, Z., Zhao, N., & Wang, S. (2026). Patterns and Environmental Drivers of Amphibian Alpha and Beta Diversity in the Huangshan Mountains, Southern Anhui, China. Ecology and Evolution, 16(10), Article e74556. https://doi.org/10.1002/ece3.74556
Image Credits: AI Generated
DOI: 10.1002/ece3.74556
Keywords: amphibians, alpha diversity, beta diversity, species turnover, precipitation, NDVI, Huangshan Mountains, environmental gradients, field survey, biodiversity hotspot, Patterns, Environmental
News Source: Drew Townsend. (October 22, 2026). Rainfall, vegetation and latitude correlate with Huangshan amphibian diversity. Scienmag.