• HOME
  • NEWS
  • EXPLORE
    • CAREER
      • Companies
      • Jobs
    • EVENTS
    • iGEM
      • News
      • Team
    • PHOTOS
    • VIDEO
    • WIKI
  • BLOG
  • COMMUNITY
    • FACEBOOK
    • INSTAGRAM
    • TWITTER
Tuesday, September 2, 2025
BIOENGINEER.ORG
No Result
View All Result
  • Login
  • HOME
  • NEWS
  • EXPLORE
    • CAREER
      • Companies
      • Jobs
        • Lecturer
        • PhD Studentship
        • Postdoc
        • Research Assistant
    • EVENTS
    • iGEM
      • News
      • Team
    • PHOTOS
    • VIDEO
    • WIKI
  • BLOG
  • COMMUNITY
    • FACEBOOK
    • INSTAGRAM
    • TWITTER
No Result
View All Result
Bioengineer.org
No Result
View All Result
Home NEWS Science News Health

NYU professor creates COVID-19 dashboard to compare country and state data

Bioengineer by Bioengineer
January 26, 2021
in Health
Reading Time: 2 mins read
0
Share on FacebookShare on TwitterShare on LinkedinShare on RedditShare on Telegram

Publicly available tool allows users to view data on vaccinations, cases, deaths, testing, and COVID-related policies

IMAGE

Credit: Credit: Alexej Jerschow/NYU

A new online dashboard, created by NYU Professor Alexej Jerschow, brings together COVID-19 data from U.S. states and countries around the world to compare cases, deaths, vaccines, and testing in a visual, user-friendly format.

The tool also integrates a range of policies governments have implemented to limit the spread of COVID-19–including school closings, stay-at-home orders, and mask mandates–in an effort to compare policy responses with COVID-19 outcomes.

Jerschow, who is a professor of chemistry and typically works in the field of magnetic resonance imaging and battery research, was looking for a convenient way to compare COVID-19 data from different countries and states. While the data were available from different sources, there was not a single tool that allowed him to easily analyze how different geographic areas were faring and responding to the pandemic–so, he created one.

“I was curious, for example, whether one could draw parallels between specific U.S. states and other countries, and also how cases correlate with policy decisions,” said Jerschow. “My hope is that this dashboard can fill the gap and become a resource to help people quickly gain an overview of how the COVID situation and policy decisions develop. It is going to be particularly interesting to look at what happens once the vaccinations ramp up further.”

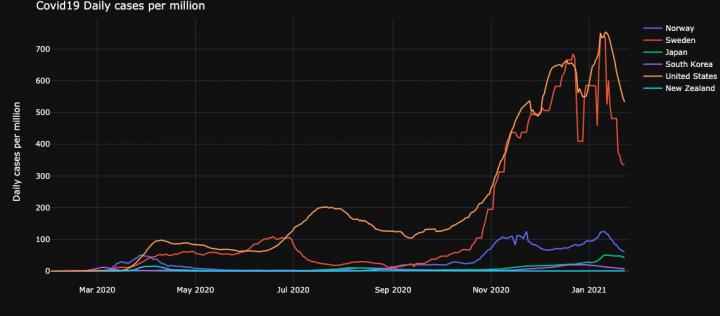
For instance, while the U.S. and Sweden have reported high numbers of COVID-19 cases and fatalities, the dashboard shows lower prevalence in countries like Japan, South Korea, New Zealand, and Norway. “It is clear from looking at the graphs that these countries have found a formula for success and government actions affected outcomes,” said Jerschow.

.

Crises are not only reflected in cases or fatalities; looking at how many positive cases of COVID-19 are found per test can reveal whether countries and states are managing the crisis well logistically. Countries such as Austria and Mexico and states such as Idaho and Alabama recently experienced periods when more than half of their tests came back positive–bringing into question whether sufficient testing is being done more than six months into the pandemic, when testing capacity should have improved.

The dashboard may be useful to researchers, educators, journalists, and the general public seeking to study COVID-19, compare all 50 U.S. states, U.S. territories, and 192 countries, and easily visualize the data.

###

The dashboard combines data from a series of publicly available sources. Country-wide information is downloaded from Our World in Data, which sources its data from the Johns Hopkins Center for Systems Science and Engineering dashboard. U.S. state and territory data are obtained from covidtracking.com. The Oxford COVID-19 Government Response Tracker (OxCGRT) provides policy data.

Media Contact
Rachel Harrison
[email protected]

Original Source

https://www.nyu.edu/about/news-publications/news/2021/january/covid-19-dashboard.html

Tags: Infectious/Emerging DiseasesMedicine/HealthPolicy/EthicsPublic HealthVaccines
Share12Tweet8Share2ShareShareShare2

Related Posts

Clinical Study Finds Azelastine Nasal Spray Cuts Coronavirus Infection Risk by Two-Thirds

September 2, 2025

CAFs Enhance Gastric Cancer Immunity via Histone Lactylation

September 2, 2025

Urban Kampala’s Private Providers: Insights on Immunization Data

September 2, 2025

Ixekizumab’s Real-World Impact on Psoriasis and Arthritis

September 2, 2025
Please login to join discussion

POPULAR NEWS

  • blank

    Breakthrough in Computer Hardware Advances Solves Complex Optimization Challenges

    154 shares
    Share 62 Tweet 39
  • Molecules in Focus: Capturing the Timeless Dance of Particles

    143 shares
    Share 57 Tweet 36
  • New Drug Formulation Transforms Intravenous Treatments into Rapid Injections

    117 shares
    Share 47 Tweet 29
  • Needlestick Injury Rates in Nurses and Students in Pakistan

    113 shares
    Share 45 Tweet 28

About

We bring you the latest biotechnology news from best research centers and universities around the world. Check our website.

Follow us

Recent News

Unraveling the Physics Behind Universal Unusual Magnetoresistance

Clinical Study Finds Azelastine Nasal Spray Cuts Coronavirus Infection Risk by Two-Thirds

Quantum researchers capture real-time magnetic flipping at the core of a single atom

  • Contact Us

Bioengineer.org © Copyright 2023 All Rights Reserved.

Welcome Back!

Login to your account below

Forgotten Password?

Retrieve your password

Please enter your username or email address to reset your password.

Log In
No Result
View All Result
  • Homepages
    • Home Page 1
    • Home Page 2
  • News
  • National
  • Business
  • Health
  • Lifestyle
  • Science

Bioengineer.org © Copyright 2023 All Rights Reserved.