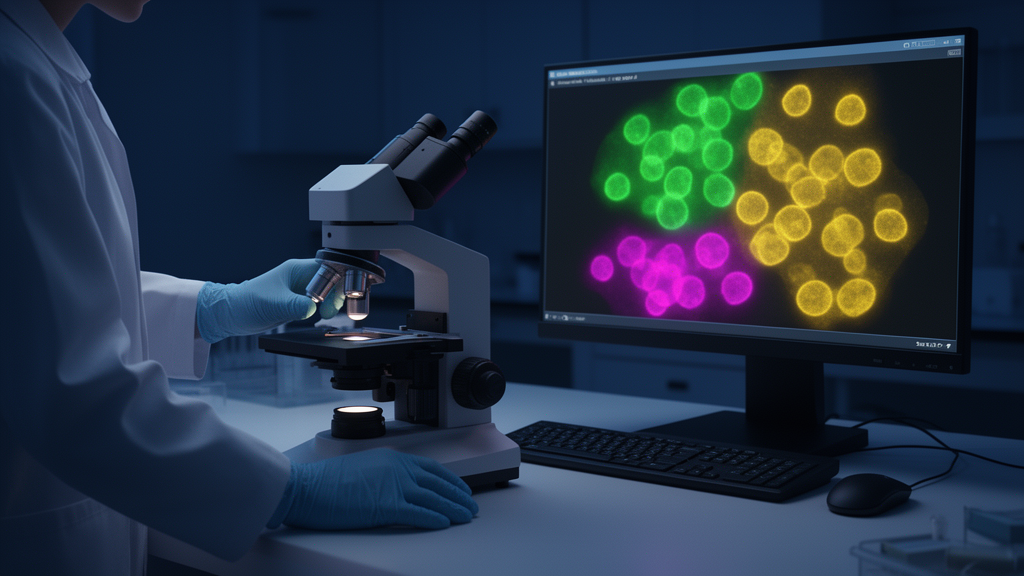
Quantifying fluorescently labeled biological structures in three dimensions has long been one of the more stubborn bottlenecks in modern microscopy. While imaging hardware has advanced dramatically over the past two decades, the software needed to count, measure, and cross-reference labeled elements across entire three-dimensional stacks has lagged behind, with most available tools still anchored in two-dimensional analysis. A team of researchers has now introduced Bioloc3D, a fully open-source toolset designed to close this gap by quantifying fluorescent labeling across complete image stacks and automating the statistical analysis that follows, according to a protocol published in BMC Methods.
The toolset, developed by Thibault Dhellemmes, Rémi Kinet, Fabrice Cordelières and Marc Landry, is built from two complementary components. The first, called Bioloc3D-Imaging or B3D-Img, is an ImageJ toolset that individualizes fluorescent elements from different channels and identifies colocalizations between them in three dimensions. The second, Bioloc3D-Plotting or B3D-Plt, is a Python-based standalone application that takes the Excel files produced by the imaging component and automatically performs statistical analysis, data summarization, and plotting. Together, the two pieces form an end-to-end pipeline that carries a dataset from raw confocal stacks to finished statistical graphics without manual intervention at intermediate steps.
The problem Bioloc3D addresses is well known to anyone working with multichannel fluorescence microscopy. Colocalization, the apparent overlap of two fluorescent signals, is frequently used to infer potential interactions between biological elements, but its interpretation depends critically on how it is measured. From a correlation perspective, colocalization occurs when the intensities of two fluorescent signals are interdependent and homogeneously distributed in space. From a co-occurrence perspective, it is determined solely by the spatial overlap of pixels or voxels. Established tools such as JaCoP and Coloc 2 offer a wide range of indicators, including Pearson’s and Mander’s coefficients, but are mostly used for two-dimensional analysis. Newer object-based tools like EzColocalization measure colocalization indicators sequentially in single images composing a stack, while DIANA focuses on distances between objects and SynQuant detects punctate profiles but restricts detection to synaptic-like shapes. According to the authors, none of these existing solutions individualizes immunolabeled profiles in 3D across multiple channels while precisely describing the number of colocalizations between them, and automation of such analysis over entire sets of stacks has been missing.
B3D-Img works by processing each stack through a structured workflow. The macro requires at minimum a stack of two channels with two images in 8-bit color depth, preferably in TIFF format, and the authors recommend a voxel depth of one micrometer, adjustable according to the size of the biological structures being analyzed. After splitting the channels, the tool quantifies objects in three dimensions using the 3D Object Counter plugin, which is essential for enumerating objects and providing characteristics such as volume and mean grey value. Thresholding discriminates objects from the background, with all voxels above the threshold considered part of an object. Voxels belonging to the same object receive a specific intensity value as a tag, and the stack is scanned systematically from left to right and top to bottom, grouping proximal voxels on adjacent or same optical sections into single objects. The method also filters counted objects that fall outside specified size minima and maxima, and calculates statistics such as volume, integrated density, and mean grey value for each object.
Colocalization analysis then proceeds through a series of image arithmetic operations. An AND operation applied to the two channels’ object maps isolates the voxels present in both, and the 3D Object Counter then provides the number and volume of colocalized objects. The mean grey value of each channel is calculated within the colocalized voxels using a 3D intensity measurement plugin. The colocalization object map is converted to a binary stack and multiplied with each channel’s object map, which assigns the tag of each overlapping object to the colocalized voxels. A histogram of the resulting stack then yields a count of colocalized voxels per object for each channel, and multiplying this voxel count by the voxel dimensions gives what the authors call the interaction volume. All collected data are compiled into Excel spreadsheets, with parameters documented in a dedicated tab to support reproducibility.
Beyond its core functions, the imaging toolset includes two optional features. The first counts somata in one or both primary channels using a ubiquitous staining method such as DAPI, employing morphological filtering and watershed segmentation on maximum-intensity projections to conserve only round-shaped elements and separate overlapping ones. The authors advise users to inspect signal saturation in these projections before running this step. The second feature verifies colocalization with an additional channel, for example a synaptic marker such as synaptophysin, by identifying overlaps between the colocalization object map and the map of the additional marker. This can be used to determine what fraction of colocalizations between two elements of interest corresponds to actual synaptic contacts.
The authors acknowledge important limitations. Processing time depends on image size and computational power, and the analysis relies on thresholding, making the signal-to-noise and signal-to-background ratios critical factors. To test performance under adverse conditions, the team deliberately used images with low signal-to-noise and moderate signal-to-background ratios, simulating the challenging conditions often faced in real microscopy data. Even so, the tool performed in a timely manner. Compared with manual identification of colocalizations per individualized object, the authors estimate that the automated macro achieves roughly a twentyfold reduction in processing time, though they note that timing varies with dataset and machine configuration. The automation also avoids interobserver variability by standardizing the analysis and provides more complex quantification of volume and intensity than manual counting allows. Confocal resolution limits can generate false colocalizations, so the authors recommend considering colocalization only when lateral resolution is below one micrometer, an estimate corresponding to acquisitions with a low numerical aperture 20x objective. They also caution that spatial colocalization must be interpreted in terms of biological relevance, and that signal density may complicate segmentation, which the optional ubiquitous staining feature can help mitigate.
The plotting component, B3D-Plt, is distributed as an executable for Windows and macOS, eliminating the need for a Python installation. Built with pandas, numpy, and seaborn, it imports the Excel files, extracts stack volumes, calculates total and mean element volumes, soma counts and areas, colocalization events, and mean contact volumes, and organizes everything by condition. For statistical visualization it employs estimation plots using the dabest package, displaying all data points as a swarm plot alongside the effect size as a bootstrap 95 percent confidence interval computed from 5,000 resamples. Output includes two Excel files, one compiling all data behind each figure and another containing statistical analyses including permutation, Welch’s, Student’s, and Mann-Whitney tests. To validate the approach, the team generated a synthetic dataset and performed both manual and automated quantifications, finding that the automated approach provided consistent results with a confidence interval exceeding 95 percent, and that self-comparisons across identical conditions showed no significant differences.
As a proof of concept, the toolset was applied to compare the GABAergic SOM/PV inhibitory microcircuit in two regions implicated in pain processing: the anterior cingulate cortex and the somatosensory cortex of mice. Using triple immunostaining for somatostatin, parvalbumin, and synaptophysin in brain sections from male and female C57BL6/J mice, the analysis revealed significant differences between the regions. The number of detected SOM and PV profiles was higher in the anterior cingulate cortex, suggesting a denser network there, and the number of SOM/PV colocalizations was also higher, although the size of these colocalizations remained unchanged between regions. Notably, SOM/PV colocalizations that also displayed synaptophysin staining represented only about one percent of total co-occurrences, at 10.04 percent reported for one comparison and 1.67 percent for the other in the figure legend, suggesting that SOM/PV interactions in these two regions are mainly extra-synaptic, a result consistent with volume transmission described for neurons expressing neuropeptides such as somatostatin. The mean number of colocalization sites per interneuron profile was higher in the anterior cingulate cortex for both interneuron types.
The method has already been used in three distinct studies on rodent brain samples, including quantification of neurons showing colocalization of a retrograde tracer with transcription factors in insula neurons, and characterization of autophagic activity in an ATP13A2-deficient rat model by distinguishing autophagosomes from autolysosomes using a pH-sensitive fluorescent reporter. Although published applications have focused on brain data, the authors emphasize that the toolset works with any fluorescent-based labeling, provided the minimal image requirements are met, and it is compatible with both raw and post-processed images as long as identical modifications are applied across all images to prevent bias. The complete toolset, along with sample datasets and step-by-step protocols, is available in open access on GitHub, reflecting the authors’ stated commitment to open science and adaptability to user needs.
Subject of Research: An open-source toolset for automated 3D quantification of fluorescent labeling and colocalization in microscopy
Article Title: Bioloc3D: an automated toolset to quantify fluorescent elements and their colocalizations in 3D
Article References: Dhellemmes, T., Kinet, R., Cordelières, F., & Landry, M. (2026). Bioloc3D: an automated toolset to quantify fluorescent elements and their colocalizations in 3D. BMC Methods, 3(1), Article 35. https://doi.org/10.1186/s44330-026-00089-0
Image Credits: AI Generated
DOI: 10.1186/s44330-026-00089-0
Keywords: Bioloc3D, fluorescence microscopy, colocalization, 3D image analysis, ImageJ, open-source software, confocal microscopy, interneurons, GABAergic microcircuit, image segmentation, statistical analysis, BMC Methods
News Source: Gregory Coleman. (October 29, 2026). New Open-Source Toolset Automates 3D Quantification of Fluorescent Colocalization. Scienmag.