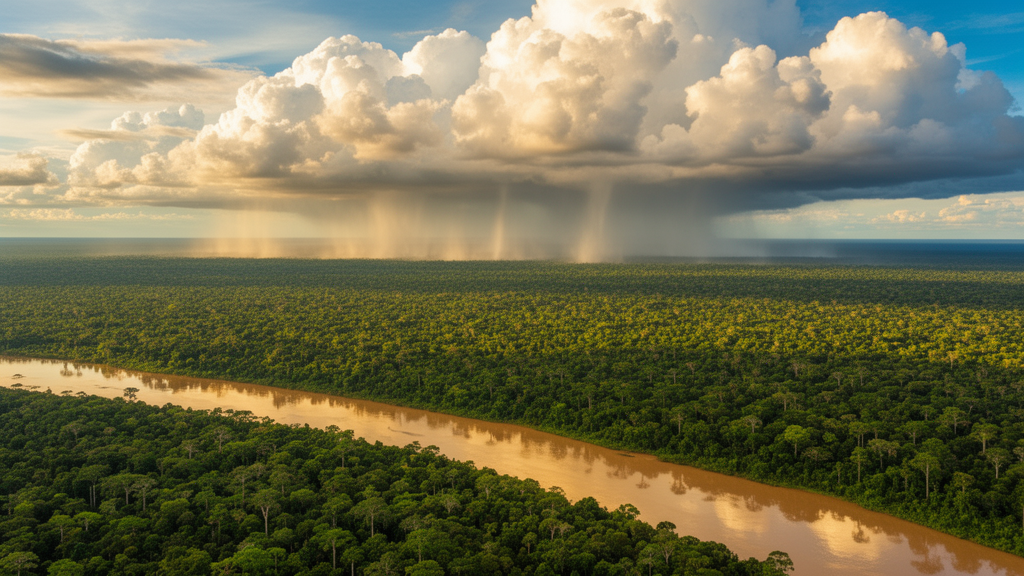
For decades, climate scientists have known that a warming of the equatorial Pacific can dry out the rains of Northeastern Brazil, but the step-by-step journey of that influence across half the planet has remained largely invisible to data-driven analysis. Now, a research team has unveiled a computational framework that reconstructs these full causal chains directly from observational data, tracing how climate anomalies propagate from the Pacific Ocean to the rainfall record of one of the world’s most drought-prone regions. The methodology, described in the International Journal of Data Science and Analytics, combines causal inference, network clustering, and optimized path selection into a single pipeline designed to be both computationally efficient and humanly interpretable. When tested against the well-documented teleconnection between the El Niño–Southern Oscillation and precipitation in Northeastern Brazil, the framework successfully recovered most of the known influence pathways, offering a new window into how distant regions of the climate system talk to each other.
Causal analysis is a cornerstone of scientific inquiry, yet Earth sciences pose a peculiar challenge: researchers cannot run controlled experiments on the planet’s atmosphere. Since the pioneering work of Granger in the 1960s and the more recent causal framework of Judea Pearl, scientists have developed data-driven techniques that infer directional relationships straight from time-series observations. Applied to climate, however, most of these methods stop at pairwise links—asking whether variable A influences variable B—without ever reconstructing the complete causal path from a source region to an affected one. That gap matters enormously for teleconnections, the climate anomalies that remotely link large-scale atmospheric circulation with precipitation and temperature far away. Teleconnection signals travel through complex, multivariate spatiotemporal interactions, and understanding the underlying causal pathways that connect them remains one of the hardest problems in climate analytics. The new study tackles precisely this problem, aiming to extract and visualize the dominant influence routes hidden inside massive climate datasets.
The benchmark phenomenon at the heart of the validation is ENSO, an atmosphere–oceanic oscillation centered on the central and eastern equatorial Pacific. When sea-surface temperatures there run one to as much as four to six degrees Celsius above the historical average, the event is named El Niño; when cooler, La Niña. During El Niño, the trade winds weaken or even reverse, allowing warm water to shift eastward and the thermocline along the Peruvian coast to deepen. La Niña does the opposite: the thermocline shallows, upwelling strengthens, and the Walker circulation—the longitudinal circulation of the equatorial atmosphere—intensifies, with enhanced convection over the western Pacific. These shifts ripple globally through temperature and precipitation. The Walker circulation that matters for South America comprises four cells: the major one has an ascending branch over the western Pacific warm pool and a descending one over the cold sea-surface temperatures of the eastern Pacific, while the smaller cells include an ascending branch over the Amazon region and two descending branches over the eastern Pacific and Atlantic oceans. ENSO anomalies can temporarily move, reverse, or even obstruct these branches.
Northeastern Brazil sits squarely in the crosshairs of these dynamics. During El Niño events its rainfall decreases; during La Niña it increases. From the Pacific, ENSO’s influence can reach the region along several consolidated routes. The Walker circulation anomalies directly modulate the vertical motions feeding the Intertropical Convergence Zone. The Pacific–North American pattern, a wave train connecting the North Pacific with North America, tends toward its positive phase during El Niño and its negative phase during La Niña, ultimately influencing North Atlantic surface pressure, the trade winds, and the ITCZ. The Pacific–South American pattern carries a southern route: in its positive mode 1, mostly associated with ENSO, a wave train travels from the equatorial western Pacific through southern South America and then equatorward, finally influencing the ITCZ and reducing Northeastern Brazil precipitation. Because these main influence paths are known and consolidated, they provide a robust yardstick for judging whether a data-driven method can recover known climate structures.
The proposed framework unfolds in three major phases and, crucially, involves no model training or testing—it operates directly on observational time series. First, gridded data are transformed and stored in relational and graph databases for fast geospatial retrieval. Second, the pipeline attacks dimensionality through complex-network clustering: each grid point is linked to its 48 nearest neighbors in a square pattern, with edge weights drawn from Pearson or Kendall correlation between neighboring time series. Edges are then filtered by thresholds of 0.90, 0.95, or 0.98, and the Louvain community detection algorithm—chosen for its speed and scalability on super-large graphs—segments the filtered networks into spatial clusters. Third comes causal processing: one representative time series per cluster is computed using mean or median, with and without normalization, and the SLARAC method—a subsampled linear auto-regression approach grounded in the Granger causality principle—scores directional causal strength between overlapping clusters. Finally, Yen’s k-shortest path algorithm, powered by Dijkstra’s method as its core subroutine, extracts the most relevant causal chains.
The data underpinning the analysis come from the fifth generation of the ECMWF Re-Analysis, ERA5, spanning 1979 to 2021 at a monthly resolution and a geographic resolution of 0.25 by 0.25 degrees. The starting date was chosen because higher-quality observational sources—stations, balloons, aircraft, ships, and satellites—became available from 1979 onward. Forty-seven variables were selected for their direct or indirect relation to the phenomena of interest, including sea-surface temperature, mean sea-level pressure, cloud cover, and, at pressure levels of 200, 500, and 850 hPa, divergence, geopotential height, potential vorticity, wind components, vertical velocity, and relative vorticity. The precipitation record for Northeastern Brazil comes from the NOAA Global Precipitation Climatology Centre, built on quality-controlled data from 67,200 weather stations worldwide. The study region is a polygon between 3 and 8 degrees south and 36 to 41 degrees west, covering much of Ceará, Rio Grande do Norte, and Paraíba—an area mixing hot semi-arid and tropical savanna climates. Only variables and regions genuinely involved in the causal chain should be detected, doubling as a validation test.
The dimensionality reduction is dramatic. The raw correlation networks contained 576,800 nodes and more than 1.3 billion links—1,322,821,440, to be exact. After clustering and causal scoring, the causal network built with Pearson correlation and a 0.95 threshold held 5,426 nodes and 2,093,392 links. The final causal-chain networks, extracted by path search, shrank to between 37 and 99 nodes and between 146 and 260 links, depending on how cluster representative time series were generated. Visual analysis on more than two million links is impracticable; on a few hundred, it becomes possible. The researchers found that Kendall correlation made clustering more sensitive to slight time-series variations and more prone to anomalous rectangular polygons parallel to the Equator at higher thresholds, so some Kendall clusterings yielded far fewer polygons than Pearson. Link values showed a clear trend: the highest causal scores clustered near the sea-surface temperature source nodes and decreased along the path toward the Northeastern Brazil precipitation sink, with every retained link ranking among the top five percent of the causal network.
The recovered causal chains reproduced much of the known climate phenomenology. Non-normalized networks highlighted pressure variables—mean sea-level pressure and surface pressure—alongside geopotential height, tracing the Walker circulation cells, with wind direction nodes concentrated at 200 hPa, the level of upper Walker branches. Normalized approaches revealed far more variable types, from cloud ice and liquid water content to divergence and relative vorticity, and detected the Pacific–South American pattern, the local ENSO forcing that boosts rainfall on the Ecuador and Peru coasts during El Niño, the North Atlantic Oscillation’s modulation of the trade winds, and the subtropical jet streams over both hemispheres. Expert-selected cluster parameters additionally exposed a path through the Arctic consistent with NAO influence on the ITCZ, and a plausible jet-stream route over northern United States and Canada. One expected phenomenon, however, eluded detection: the Pacific–North American pattern never emerged clearly, with the framework instead capturing the Pacific subtropical jet stream during El Niño events. The authors attribute this to event intermittency, weak local influence, monthly data aggregation, or unrepresentative cluster shapes.
The implications stretch from diagnosis to prognosis. In diagnostics, the methodology can identify critical drivers behind specific events such as droughts or heavy rainfall, using variables like wind, sea-surface temperature, and geopotential height, helping recognize recurring patterns essential for understanding extremes. In prognostics, mapping causal trajectories offers a robust basis for anticipating how climate patterns evolve in response to ENSO events, potentially enhancing long-term forecasting accuracy. Compared with simulation-based approaches, the framework carries lower computational costs and provides an interactive platform where users can freely change source and sink nodes and query complex patterns without extensive recomputation. Limitations remain: the method was designed for monthly-scale phenomena and may not transfer to weekly or daily resolutions without adaptation; it requires users to select multiple parameters, from clustering configuration to the k value in Yen’s algorithm; and the SLARAC component lacks explicit mechanisms for handling confounding variables. Still, the study demonstrated that full causal chains can be extracted from high-dimensional climate data—no significant spurious detections were observed—marking a meaningful advance for data-driven climate analytics.
Subject of Research: A data-driven causal chain detection methodology applied to the ENSO modulation of Northeastern Brazil precipitation
Article Title: A multivariate causal chain detection methodology assessed on the ENSO modulation of the Northeastern Brazil precipitation
Article References: Cruz, J. E. C., da Rocha, V. R., de Andrade, F. M., & Quiles, M. G. (2026). A multivariate causal chain detection methodology assessed on the ENSO modulation of the Northeastern Brazil precipitation. International Journal of Data Science and Analytics, 22(1), Article 353. https://doi.org/10.1007/s41060-026-01322-3
Image Credits: AI Generated
DOI: 10.1007/s41060-026-01322-3
Keywords: ENSO, El Niño, causal inference, teleconnections, Northeastern Brazil, climate analytics, Walker circulation, SLARAC, Louvain algorithm, ERA5, precipitation, data science
News Source: Blake Davidson. (October 23, 2026). New causal chain method traces how El Niño shapes Brazil’s rainfall. Scienmag.