Credit: Credit: NASA/NRL
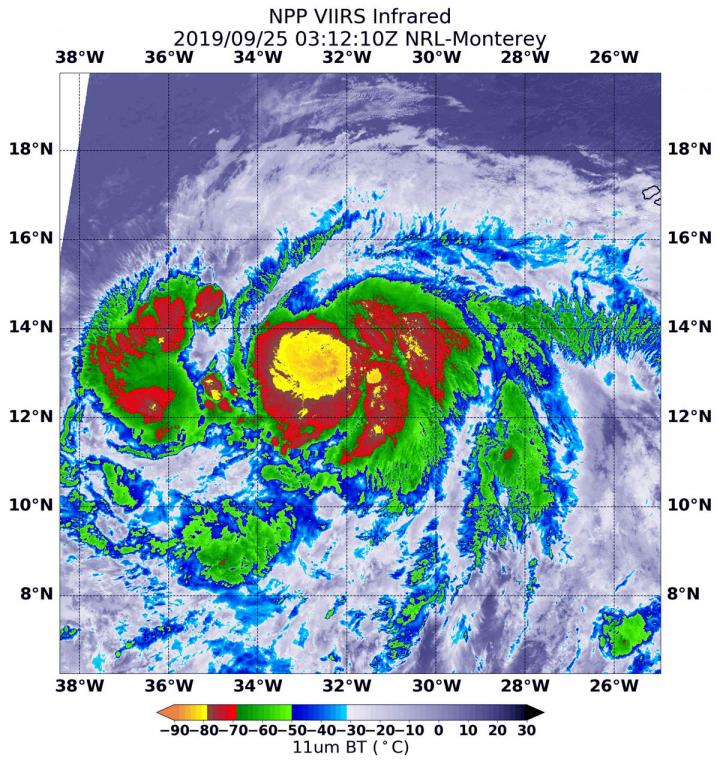
Dropping cloud top temperatures from NASA-NOAA’s Suomi NPP satellite indicated Hurricane Lorenzo was getting stronger in the North Atlantic Ocean.
The Visible Infrared Imaging Radiometer Suite (VIIRS) instrument aboard Suomi NPP provided an infrared image of the storm. Infrared imagery reveals cloud top temperatures, and the higher the cloud top, the colder it is, and the stronger the storm. On Sept. 25 at 0312 UTC (Sept. 24 at 11:12 p.m. EDT) a large area of powerful thunderstorms circled the eye where cloud top temperatures were as cold as minus 121 Fahrenheit (minus 85 degrees Celsius). NOAA’s National Hurricane Center (NHC) forecasters cited that data in their Discussion at that time.
NASA research has shown that storms with cloud tops that cold have been found to generate heavy rainfall.
Later in the day, at 11 a.m. EDT (1500 UTC), the center of Hurricane Lorenzo was located near latitude 14.1 degrees north and longitude 35.1 degrees west. That is about 715 miles (1,155 km) west of the southernmost Cabo Verde islands. Lorenzo is moving toward the west-northwest near 17 mph (28 kph), and this motion is expected to continue through Thursday.
A turn toward the northwest is expected late Thursday. Maximum sustained winds have increased to near 85 mph (140 kph) with higher gusts. Additional strengthening is forecast during the next couple of days, and Lorenzo is forecast to become a major hurricane by Thursday [Sept. 26]. The estimated minimum central pressure is 983 millibars.
Hurricanes are the most powerful weather event on Earth. NASA’s expertise in space and scientific exploration contributes to essential services provided to the American people by other federal agencies, such as hurricane weather forecasting.
For updated forecasts. visit: http://www.
###
Media Contact
Rob Gutro
[email protected]
Original Source
https:/


