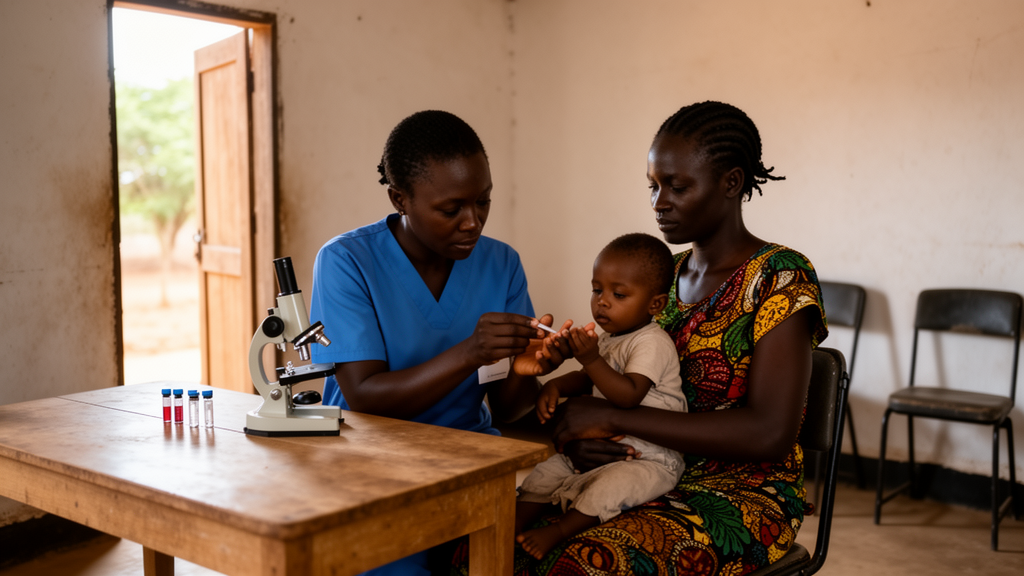
Of 280 planning zones mapped across Uganda’s higher-level public health facilities, 122 had none of the four essential sickle cell disease services, and 205 had no more than one, according to a new national spatial prioritisation study published in BMC Global and Public Health. The analysis, which combined modelled geographic access, epidemiological risk surfaces, and facility service inventories, found that the highest-priority zones for service strengthening were concentrated mainly in northern, north-eastern, eastern, and parts of central Uganda, while lower-priority tiers were more common in the south-west.
The study, led by George Paasi and colleagues, set out to answer a practical planning question: which existing public facilities warrant closer assessment for strengthening newborn screening, hydroxyurea availability, blood transfusion support, or specialised sickle cell disease clinic care? Rather than relying on administrative boundaries, the researchers built the framework around facility-linked planning zones, each anchored to one of 280 eligible Health Centre IV and higher-level public facilities. Populated cells were assigned to their nearest eligible facility and retained only where modelled travel time was 60 minutes or less, producing standardised planning zones rather than observed utilisation catchments.
The epidemiological backbone of the framework was a co-risk index combining two spatial surfaces: an interpolated national map of haemoglobin S allele frequency, assembled from two national datasets, and a modelled Plasmodium falciparum parasite rate among children aged 2 to 10 years, drawn from the Malaria Atlas Project for 2015 through 2024. Both inputs were rescaled to a common zero-to-one range and averaged with equal weights. The authors emphasise that the two surfaces are not statistically or biologically independent, because historical malaria selection contributed to the population distribution of haemoglobin S, so the co-risk score should be read as a study-specific relative epidemiological-context index rather than a biologically calibrated prevalence model.
Service availability was assessed from a facility inventory that coded four binary indicators: whether a facility was recorded as providing or participating in newborn or early infant screening, providing hydroxyurea, offering onsite blood transfusion, or running dedicated sickle cell disease clinic follow-up. The reported service-domain breadth score was the unweighted sum of these four indicators, and the service-deficit score was its complement. The authors caution that these binary indicators described reported local service configuration and could not distinguish service intensity, readiness, reliability, patient uptake, or effective access, meaning a high-capacity referral hospital and a facility with nominal reported availability could receive the same value.
The results revealed a strikingly sparse service landscape. Beyond the 122 catchments with no reported services, 83 had one service, 32 had two, 20 had three, and only 23 had all four. Co-risk values ranged from 0.003 to 0.934 with a median of 0.433, and the service-mediated structural vulnerability index, a multiplicative combination of co-risk and standardised service deficit, ranged from 0.000 to 0.905. All 20 top-ranked catchments on the vulnerability index fell in the high co-risk, low service-breadth group, and the five highest-ranked had no availability to any of the four service domains.
The overall programme-priority score, the study’s primary national ranking, combined co-risk and standardised service deficit with equal dominant weights of 0.45 each, plus a smaller 0.10 contribution from facility-recorded sickle cell disease mortality drawn from routine health management information system data covering 2020 to 2024. The authors stress that these weights were investigator-specified normative planning choices, not empirically estimated coefficients. Over the five-year period, the dataset captured 65,800 recorded sickle cell disease admissions and 1,010 recorded deaths, which the authors interpret as routine-system visibility of severe events rather than independent estimates of community incidence or demand.
Subregional summaries showed that overall programme priority was concentrated most strongly in Lango, Teso, Acholi, Karamoja, and Busoga. The highest population-weighted mean priority scores were observed in Lango at 0.667, Teso at 0.640, Acholi at 0.633, Karamoja at 0.632, and Busoga at 0.618. The 56 catchments comprising the national top 20 percent of programme priority contained approximately 7.0 million people, representing 17.3 percent of the 40.4 million people represented within the analytic framework. Because the priority group was defined by catchment count rather than cumulative population, its population share was not expected to equal 20 percent, and the top-priority catchments were descriptively about 13 percent less populous on average than the full catchment set.
Service-specific rankings revealed that expansion is unlikely to follow a single geographic pattern. Newborn screening and hydroxyurea priorities were closely aligned and concentrated strongly in the north-east, east, and south-east, suggesting a shared geography of estimated service-to-need mismatch for early diagnosis and disease-modifying therapy. Transfusion priorities had a broader footprint, extending across the east, north-east, north, and parts of the north-central belt, while specialised clinic priorities were more selective, concentrated mainly in the east and north. The overall coverage-to-need gap, an arithmetic difference between co-risk and normalised reported service breadth, had a national mean of 0.190 and a median of 0.205, with the highest-gap quintiles broadly overlapping the main priority corridor.
The authors tested the stability of their rankings across six weighting specifications. The base, no-burden, death-heavy, and admission-heavy specifications selected the same 50 planning zones, indicating that removing the routine-burden component did not change membership of the top set. Overlap with the base specification was lower under co-risk emphasis, at 41 of 50, and lower still under service-deficit emphasis, at 36 of 50. The authors note that this variation reflects transparent planning trade-offs rather than methodological weakness, but that the results do not address uncertainty in the epidemiological surfaces, planning-zone geometry, travel-time threshold, or service indicators.
The study carries substantial limitations that the authors set out explicitly. The framework was predominantly supply-side and facility anchored, with no demand-side data on patient origins, care-seeking, affordability, bypassing, referral flows, or realised utilisation. The 60-minute travel-time threshold was a planning specification rather than a clinical standard, and alternative thresholds were not evaluated. Uncertainty in the interpolated haemoglobin S and modelled malaria surfaces was not propagated through the composite indices, so the rankings are conditional point estimates without confidence intervals. The outputs were also not externally validated against independent data on confirmed sickle cell disease prevalence, screening yield, or patient residence. The authors position the framework as one decision-support input that can guide subsequent programme assessment, readiness assessment, costing, and stakeholder review, rather than a prescription for resource allocation, and they note that Greater Kampala’s absence from the top-priority set should not be interpreted as absence of need.
Subject of Research: A national spatial prioritisation framework identifying where essential sickle cell disease services should be expanded across Uganda's health-facility catchments
Article Title: A national spatial prioritisation framework for the targeted expansion of essential sickle cell disease services across health-facility catchments in Uganda
Article References: Paasi, G., Ndeezi, G., Namazzi, R., Mupere, E., Munabi, I. G., Kiguli, S., Idro, R., & Olupot-Olupot, P. (2026). A national spatial prioritisation framework for the targeted expansion of essential sickle cell disease services across health-facility catchments in Uganda. BMC Global and Public Health, 4(1), Article 99. https://doi.org/10.1186/s44263-026-00338-y
Image Credits: AI Generated
DOI: 10.1186/s44263-026-00338-y
Keywords: sickle cell disease, Uganda, spatial prioritisation, health facility catchments, newborn screening, hydroxyurea, blood transfusion, malaria, health service planning, geospatial analysis, sub-Saharan Africa, health equity
News Source: Ophelia Keating. (October 29, 2026). Mapping where Uganda’s sickle cell services fall short of need. Scienmag.