Measurements from BT Tower observatory show impact of reduced activity in UK’s capital due to COVID-19 pandemic

Credit: UKCEH
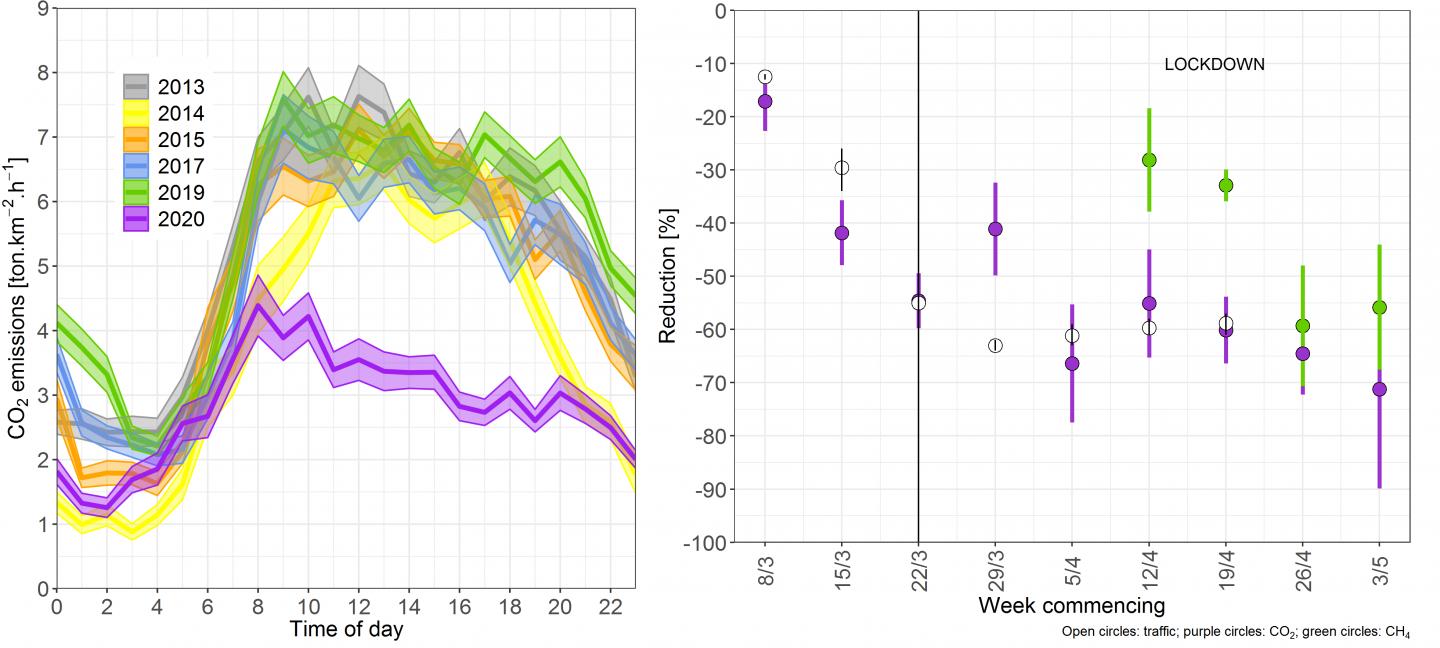
A new comprehensive analysis has revealed carbon dioxide (CO2) emissions in London have reduced by almost 60 per cent during the COVID-19 lockdown.
Previous analyses of CO2 emission reductions have been based on estimates of changes in traffic, industrial and commercial activity during the lockdown. Changes in atmospheric concentrations of this and other greenhouse gases can be difficult to interpret because they depend strongly on meteorological conditions.
Direct measurements of the emissions themselves are hence required but relatively few sites are equipped to do this, one being the BT Tower Atmospheric Observatory in London. Scientists from the UK Centre for Ecology & Hydrology and the University of Reading say their measurements from the BT Tower have shown clear evidence of a significant reduction in CO2 emissions in London between the start of the lockdown on 23 March and the first week of May, compared with the long-term average for this time of year.
For the period 8am-8pm, the reduction in CO2 emissions was 58 per cent which very closely mirrors the daily reduction of 60 per cent in traffic flow in central London reported by Transport for London during the first five weeks of the UK’s lockdown.
Dr Eiko Nemitz of the UK Centre for Ecology & Hydrology (UKCEH) says: “The 190m-tall BT Tower in central London is an excellent platform for pollution monitoring at the heart of Europe’s largest city; these measurements offer a unique insight into changes in fossil fuel use and CO2 emissions both during the lockdown and as we gradually come out of it. They will also help us understand how emissions of other pollutants have changed over this unprecedented period.”
The lockdown has significantly reduced London’s daytime population and commercial activity. However, it is difficult to quickly calculate the emissions from individual sources such as vehicle traffic, natural gas usage for heating of buildings, plus exhalation from people – particularly as these are mitigated slightly by carbon ‘sinks’, mainly through the uptake of CO2 by vegetation in parks, gardens and streets.
But Dr Nemitz says: “The fact that the reduction in CO2 emissions in central London almost exactly correlates with the reduction in traffic provides further evidence that vehicle emissions are a major source of CO2 in London, and that traffic is closely linked with other CO2-emitting activities such as the heating of shops and offices.
“The short-term reductions in emissions will not markedly change global atmospheric concentrations of CO2 and global warming. However, measurements of pollution during the lockdown and as it eases will provide valuable evidence on how air quality might change as sources of emissions are reduced, for example as part of the UK’s transition to net zero greenhouse gas emissions.”
Professor Janet Barlow of the University of Reading explains the longer-term impact of the lockdown on emissions is difficult to predict because behaviours might change as lockdown rules are relaxed. She says: “Some people may prefer to use private cars rather than public transport to avoid the risk of contracting COVID-19, which may cause a fast growth of emissions that may exceed those of the pre-lockdown period. On the other hand, the lockdown may kick-start a new enthusiasm for walking and cycling, and some cities are now investigating measures to promote alternatives to car use. In addition, regular home working may remain the norm for many people.”
The BT Tower Atmospheric Observatory collaborates with the Integrated Carbon Observation System (ICOS), a European-wide greenhouse gas research network. Measurements of CO2 emission reductions from monitoring sites elsewhere in Europe, over a 24-hour period compared with the same time last year, ranged from 8 per cent in a highly vegetated urban area of Berlin to 75 per cent in the city centre of Heraklion, Greece. Reductions in CO2 emissions in parts of Florence, Basel and Helsinki during the lockdowns were around 40 per cent.
###
NOTES TO EDITORS
1. The ICOS study used slightly different methodology and timeframes to the measurements quoted for London in this release. The study, which has not yet been peer reviewed, is available at https:/
2. The BT Tower Atmospheric Observatory is a collaboration between UKCEH, the University of Reading and the National Centre for Atmospheric Science. Measurements of CO2 and methane emissions first began in 2006. The research is supported by National Capability funding from the Natural Environment Research Council (NERC). UKCEH is a strategic delivery partner for the NERC, part of UK Research and Innovation (UKRI).
For media enquiries
For interviews and further information, please contact Simon Williams, Media Relations Officer at UKCEH, via [email protected] or +44 (0)7920 295384.
About the UK Centre for Ecology & Hydrology (UKCEH)
The UK Centre for Ecology & Hydrology is a centre for excellence in environmental science across water, land and air. Our 500 scientists work to understand the environment, how it sustains life and the human impact on it – so that together, people and nature can prosper.
We have a long history of investigating, monitoring and modelling environmental change, and our science makes a positive difference in the world. The issues our science addresses include: air pollution, biodiversity, biosecurity, chemical risks, extreme weather events, droughts, floods, greenhouse gas emissions, land use, soil health, sustainable agriculture, sustainable ecosystems, sustainable macronutrient use, and water resources management.
The UK Centre for Ecology & Hydrology is a strategic delivery partner for the Natural Environment Research Council, part of UK Research and Innovation.
http://www.
Media Contact
Simon Williams
[email protected]


