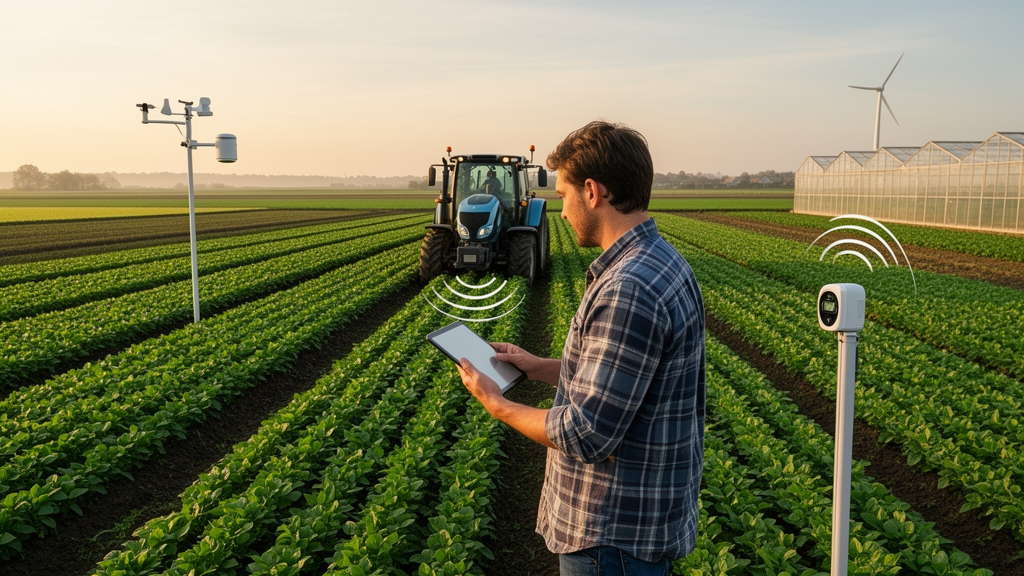
A new global index places the Netherlands, Israel, Belgium, Denmark and Luxembourg at the top of 119 countries assessed for their apparent readiness to absorb digital technologies in agriculture, while five African countries occupy the bottom five positions. The Propensity for Agricultural Digital Transformation Index, or PADiTIndex, combines four country-level measures: agricultural productivity efficiency, the value of agricultural production per agricultural worker, food-system resilience to climate change, and national openness to innovation. It is designed to estimate readiness before digital adoption occurs, rather than to measure how many farmers or farms actually use connected sensors, drones, precision irrigation or other digital tools.
The study, published in Discover Agriculture, used annual data from 2015 through 2022 drawn from FAOSTAT, the Notre Dame Global Adaptation Initiative, the US Department of Agriculture and the Global Innovation Index. A missing value was interpolated only where a country had no more than two missing years for an indicator, after which the researchers calculated 2015–2022 averages. They transformed the four measures onto comparable scales with logarithmic normalization and combined them with a geometric mean, giving each dimension equal weight. A very low score in any one component therefore constrains the overall index, reflecting the idea that digital transformation depends on complementary national capabilities rather than on strength in a single area alone. Countries lacking data for any indicator, or with more than two missing years in an indicator’s time series, were excluded, producing a final sample of 119 countries.
The Netherlands achieved the highest numerical score, 0.956, followed by Israel at 0.941, Belgium at 0.939, Denmark at 0.935 and Luxembourg at 0.933. Germany ranked sixth with 0.932, while the top ten extended down to Malta at 0.923, leaving only about a 3.5% relative difference across that group. The researchers advised that close scores should be interpreted cautiously because the index produces a single deterministic value for each country and the study did not apply statistical significance tests to its rankings. The pattern nevertheless offers a market-oriented snapshot: several affluent European economies combine high-value agricultural production, strong innovation systems and relatively climate-resilient food systems. The five leading countries included four European nations and Israel, with Germany also in the top six.
At the other end of the ranking, Niger scored 0.573, followed by Madagascar at 0.635, Burkina Faso at 0.636, Ethiopia at 0.637 and Guinea at 0.643. Their positions were driven most clearly by comparatively weak food-system resilience and limited national openness to innovation. The authors linked these conditions to reliance on rain-fed agriculture, greater exposure to climate variability, insufficient rural digital infrastructure, low digital skills and incomplete national innovation strategies. Those factors are associations within the dataset, however, rather than demonstrated causes of low digital adoption, and the study did not directly test whether particular investments caused a country’s score to rise. Africa had the lowest regional average among the five regions represented, while Oceania, Europe, America and Asia recorded higher averages in descending order.
Food-system resilience contributed the largest relative weight in the index’s decomposition, with a standardized coefficient of 0.47, while production value per agricultural worker had a coefficient of 0.39. Openness to innovation followed at 0.19, and agricultural total factor productivity at 0.05. These figures describe how the composite score is mathematically structured; they are not causal effects. Indeed, a log-log regression of the index on its four components is an algebraic identity because the index was constructed from those same variables, so its high explanatory value cannot independently validate the measure. The stronger interpretation comes from the component scores: value generated per agricultural worker provides an indication of resources potentially available for modernization, while the reversed ND-GAIN vulnerability score represents a food system’s relative climate resilience. The researchers used the ND-GAIN Food Vulnerability Score for 2015–2022, reversing its polarity so that higher values represented greater resilience.
Agricultural total factor productivity captures a different dimension, measuring how efficiently countries combine land, labor, capital and other inputs rather than the absolute value of production. Based on a 2015 baseline of 100, 74 of the 119 countries maintained or improved their efficiency by 2022. Iceland recorded the largest increase at 152.24%, followed by Saudi Arabia at 142.83%, Bahrain at 125.45%, Tajikistan at 124.76% and Armenia at 123.85%. At regional level, Asia’s average productivity efficiency rose 13.83% over the period, while the increase for the Americas was 0.53%. This component was only weakly correlated with the other three measures, indicating that it supplied distinct information rather than simply duplicating economic development or climate resilience. The measure was sourced from the USDA and tracks changes in productivity rather than absolute production levels.
The economic component was calculated as the monetary value of total agricultural production divided by the number of people economically active in agriculture. Using production value per worker rather than total production value changed some rankings substantially: China, Viet Nam, Thailand and India moved down, while Brunei Darussalam, Bahrain, Malta and Qatar moved up, and the Spearman rank correlation between the two specifications was 0.91. The Netherlands remained first under both measures. The authors argued that the per-worker formulation better approximates the financial capacity that can be mobilized for each part of the agricultural workforce, although it does not reveal how agricultural income is distributed or whether small producers can access it. The Netherlands ranked ninth on this component, while Israel had the highest production value per agricultural worker among the countries studied.
Openness to innovation was represented by the Global Innovation Index, which measures a country’s broad capacity to generate and use innovation rather than agriculture-specific digital readiness. Switzerland, Sweden, the United States, the United Kingdom and the Netherlands led this component, while Zambia, Benin, Niger, Togo and Guinea ranked lowest. Among seven Global Innovation Index pillars, “human capital and research” and “infrastructure” had the strongest correlations with PADiTIndex, both about 0.89. The authors interpreted this as evidence that skills, research capacity and enabling infrastructure may be more closely aligned with digital agricultural readiness than market sophistication alone. These correlations are internal consistency checks, not external validation, because the overall innovation score is itself one of the index’s four inputs. The Global Innovation Index also does not directly capture rural connectivity, practical digital skills in agriculture or the readiness of agricultural value chains.
Several limitations constrain how far the rankings can be generalized. The index excludes direct ICT infrastructure, internet access, mobile connectivity, digital skills and observed adoption rates. Comparable data on population digital skills were available for only 44–45 of the 119 countries, so including them would have sharply reduced coverage and biased the sample toward wealthier economies. In addition, only eight low-income countries entered the sample, compared with 50 high-income, 34 upper-middle-income and 27 lower-middle-income countries. Seventeen excluded low-income economies were predominantly conflict-affected or fragile states, including Afghanistan, the Democratic Republic of the Congo, Somalia, Sudan, Syria and Yemen, which limits conclusions about low-income Africa. Agricultural production values also included some estimates, and the study noted that the external ND-GAIN and Global Innovation Index series may not continue to be produced in future updates.
Robustness checks showed that the ordering changed very little under alternative weighting methods. Correlations between the equal-weight ranking and rankings based on principal component and entropy weights were 0.999 and 0.995, respectively. Removing one indicator at a time produced correlations of 0.999 without agricultural productivity, 0.969 without production value per worker, 0.984 without vulnerability and 0.994 without the Global Innovation Index. The authors regard the index as a development-oriented diagnostic rather than four fully independent dimensions, because production value, food-system resilience and innovation openness were strongly intercorrelated, with pairwise correlations of 0.82–0.86. External validation against comparable measures of actual digital-agriculture adoption remains essential, but the researchers noted that no globally complete quantitative dataset currently exists; the index therefore measures propensity up to 2022, not present adoption or a forecast of future transformation. Because digital technology changes rapidly, the authors also emphasized that retrospective scores can become outdated and proposed updating the index as new data become available.
Subject of Research: A global composite index assessing country-level propensity to adopt digital agricultural technologies.
Article Title: Novel index on the propensity for digital transformation in agriculture (PADiTIndex)
Article References: Tindjiete, S. D. Y., Epule, T. E., Célicourt, P., Etongo, D., Peng, C., & Poirier, V. (2026). Novel index on the propensity for digital transformation in agriculture (PADiTIndex). Discover Agriculture, 4(1), Article 326. https://doi.org/10.1007/s44279-026-00800-3
Image Credits: AI Generated
DOI: 10.1007/s44279-026-00800-3
Keywords: digital agriculture, agricultural innovation, global index, climate resilience, agricultural productivity, food systems, rural connectivity, innovation capacity, country rankings, precision agriculture, Novel, index
News Source: Alan Morgan. (October 22, 2026). Global Index Ranks Countries Most Ready for Digital Agriculture. Scienmag.