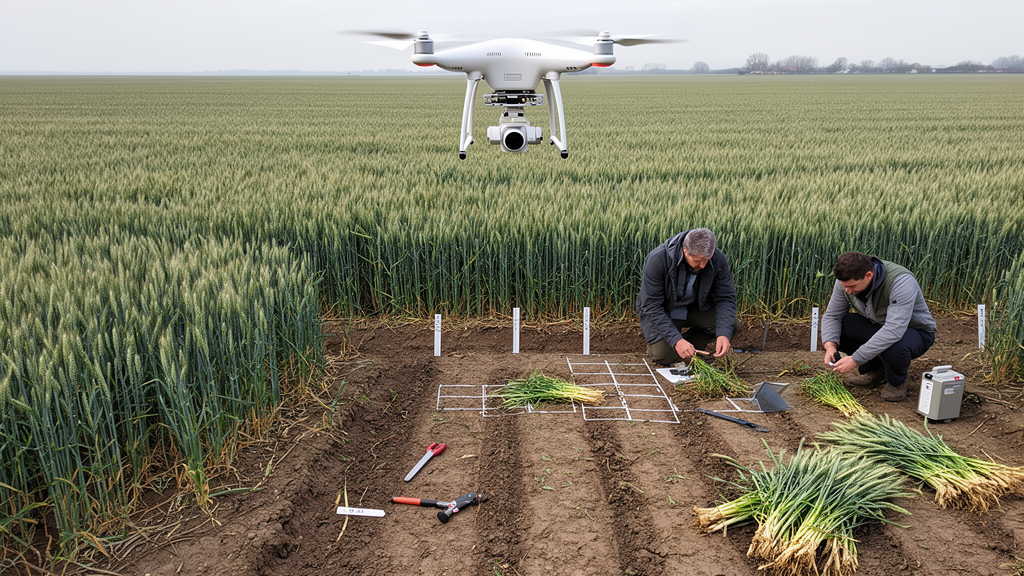
Unmanned aerial vehicle observations combining canopy color, image texture, three-dimensional structure and change across the growing season can estimate winter wheat aboveground biomass more accurately than any single type of remote-sensing feature. In a two-season field study, a random forest model using all four information sources achieved the highest pooled-model coefficient of determination, or R², of 0.923. Across the four machine-learning algorithms evaluated with the complete feature set, root mean square errors ranged from 1.731 to 2.211 megagrams per hectare, and ratios of performance to deviation exceeded 2.823.
The experiments covered 115 plots sampled at four wheat growth stages, yielding 920 aboveground-biomass observations across the 2024–2025 and 2025–2026 growing seasons. The research was conducted at the Xinxiang Comprehensive Base of the Chinese Academy of Agricultural Sciences in China’s Huang–Huai–Hai Plain. Three experiments were designed to create a broad range of canopy conditions.
The first crossed 13 wheat cultivars with four nitrogen levels, producing 52 treatments; it was intended to generate variation in crop growth and biomass rather than statistically compare the effects of nitrogen. A second experiment combined four irrigation regimes with three nitrogen levels for 36 plots of the cultivar Bainong5819. A third tested three irrigation regimes and three nitrogen levels across 27 plots of Bainong4199.
Field campaigns occurred at jointing, booting, anthesis and grain filling. At each sampling, three replicates of 20 wheat plants were collected per plot, oven-killed and dried to constant weight to determine biomass. Each ground campaign was synchronized with flights by two unmanned aerial platforms.
A DJI Mavic 3 M carried an RGB sensor and four multispectral bands—green, red, red edge and near infrared—while a DJI Matrice 300 RTK equipped with a Zenmuse L2 sensor collected LiDAR point clouds. The multispectral imagery had a ground sampling distance of approximately 0.70 centimetres per pixel. Following noise removal, voxel downsampling, ground classification and registration, the retained LiDAR clouds averaged about 1,200 points per square metre.
The researchers excluded the outer two rows of plants from each plot region of interest to reduce edge effects, mixed pixels and positional uncertainty. Independent checkpoints gave a horizontal root mean square error of approximately 0.02 metres for the multispectral orthomosaics, while registration error between growth stages remained below 0.04 metres. Spectral, structural and temporal information was extracted to represent different aspects of the canopy.
Eight gray-level co-occurrence matrix measures—mean, variance, homogeneity, contrast, dissimilarity, entropy, energy and correlation—were calculated in each of the four spectral bands, giving 32 texture variables. LiDAR measurements supplied canopy-height percentiles, coverage, vertical point distribution and canopy volume. Derived features combined information across growth stages: stage-to-stage differences, relative changes, canopy-volume-multiplied vegetation indices and an area-under-the-trajectory measure linking canopy volume with vegetation-index values.
Variables requiring a preceding observation could not be generated at jointing but were available at subsequent stages. Four regression algorithms—k-nearest neighbor, partial least squares regression, support vector regression and random forest—were compared within a nested cross-validation framework grouped by plot identity. Measurements from the same plot across years and stages were kept in the same group, preventing repeated observations from appearing in both training and testing sets.
Feature construction, feature selection, normalization and hyperparameter optimization were performed only within each outer training fold. Competitive adaptive reweighted sampling selected candidate variables, variance inflation factor analysis removed remaining multicollinearity, and SHAP analysis quantified the contributions of retained features to out-of-fold predictions. This design evaluated the added information from combining data sources while reducing the chance that model performance would be inflated by leakage of repeated field measurements.
Multi-source fusion produced the strongest pooled results. Models combining vegetation indices, texture features and LiDAR-derived structure reached R² values of 0.901 for random forest and 0.912 for k-nearest neighbor, with root mean square errors of 1.951 and 1.836 megagrams per hectare, respectively. Adding derived features increased the random forest R² by 2.44% relative to that basic fusion, while a model using derived features alone performed comparably to basic multi-source fusion.
The complete feature set produced R² values of 0.915 for k-nearest neighbor, 0.875 for partial least squares regression, 0.911 for support vector regression and 0.923 for random forest. Random forest had the narrowest residual distribution around zero and was used for subsequent stage-wise interpretation and plot-scale mapping. The strongest raw correlations did not necessarily become the most influential model inputs.
LiDAR structural measurements had the highest overall correlations with biomass, with coefficients from 0.85 to 0.87 for leading height variables, while several texture features reached absolute correlations of 0.72 to 0.76. In the complete random forest model, however, the derived trajectory measure combining canopy volume and near-infrared information ranked first by mean absolute SHAP value. Canopy coverage ranked second, followed by the relative change in the modified chlorophyll absorption in reflectance index.
Other derived variables—including a canopy-volume and red-band trajectory measure, a change in red-band homogeneity and a change in a canopy-volume multiplied near-infrared feature—had moderate importance. Across the four algorithms, derived features generally contributed more than the basic vegetation-index, texture and LiDAR variables, and canopy coverage remained prominent in each model. Performance changed when the pooled model’s out-of-fold predictions were separated by growth stage.
Its R² values were 0.416 at jointing, 0.555 at booting, 0.378 at anthesis and 0.485 at grain filling. The pooled model tended to overestimate biomass at jointing and booting and underestimate it at anthesis and grain filling. Growth stage by itself was a strong predictor, explaining 85.2% of biomass variation, but remote-sensing features supplied additional information about differences among plots within stages.
Incremental R² values reached 0.479 for random forest, 0.422 for k-nearest neighbor, 0.397 for support vector regression and 0.150 for partial least squares regression. The imagery therefore explained within-stage variation that was not captured by predictions based solely on the mean biomass for each growth stage. Models developed separately for each growth stage performed best at booting.
A support vector regression model using vegetation indices, textures and LiDAR achieved an R² of 0.632, a root mean square error of 1.425 megagrams per hectare and a ratio of performance to deviation of 1.659 there. The best jointing model was a k-nearest neighbor using the same three feature groups, with an R² of 0.426, a root mean square error of 0.575 megagrams per hectare and a ratio of performance to deviation of 1.335. At anthesis and grain filling, the complete-feature random forest performed better among the evaluated models, with R² values of 0.452 and 0.473, respectively.
Their ratios of performance to deviation were 1.418 and 1.413. The dominant predictors also shifted with development: the modified triangular vegetation index led at jointing, green-band contrast at booting, near-infrared reflectance and a relative canopy-volume multiplied modified triangular index at anthesis, and a red-band mean-texture change at grain filling. Applying the final random forest at plot scale mapped increasing biomass from jointing through grain filling and showed differences among cultivars, nitrogen and irrigation treatments, with generally higher estimates under greater water and nitrogen availability.
Residual maps contained both positive and negative errors, although most plots had relatively small deviations. The findings nevertheless require a bounded interpretation because the experiments came from one site and two seasons. Bidirectional validation between years produced an R² of 0.738, a root mean square error of 3.189 megagrams per hectare and a ratio of performance to deviation of 1.954, below the study’s threshold of 2.0 for reliable prediction.
Models trained on 2025 data tended to overestimate biomass when applied to 2026, whereas models trained on 2026 data tended to underestimate it when applied to 2025. The temporal design also limits how the pooled model should be used. Because its trajectory incorporates observations from later growth stages, it is better characterized as a retrospective biomass-estimation model than as an early-season forecasting system; stage-specific models used only observations available by the corresponding stage.
The experiments were also confined to one location in the Huang–Huai–Hai Plain, a particular UAV sensor configuration and a specific feature-extraction workflow. Vegetation masking depends on the separability of canopy and soil, while texture features are sensitive to window size, spatial resolution and image preprocessing. Validation across other climatic regions, wheat cultivars, management practices, sensors, illumination conditions and modeling strategies is therefore needed before the fused approach can be considered broadly applicable.
Within those limits, the study shows that combining spectral, spatial, structural and multi-stage information can improve winter wheat biomass estimation while revealing that the relative value of each predictor changes as the canopy develops.
Subject of Research: Multi-source UAV feature fusion for estimating winter wheat aboveground biomass
Article Title: Integration of multi-source UAV remote sensing features and derived features for winter wheat aboveground biomass estimation
Article References: Wang, G., Yao, S., Xie, Y., Qin, A., Chen, X., Zhang, Y., & Jiang, L. (2026). Integration of multi-source UAV remote sensing features and derived features for winter wheat aboveground biomass estimation. Smart Agricultural Technology, 15, Article 102656. https://doi.org/10.1016/j.atech.2026.102656
Image Credits: AI Generated
DOI: 10.1016/j.atech.2026.102656
Keywords: winter wheat, aboveground biomass, unmanned aerial vehicles, multispectral imaging, LiDAR, machine learning, random forest, feature fusion, crop monitoring, precision agriculture, Integration, multi-source
News Source: Alan Morgan. (October 20, 2026). Fused UAV data improve winter wheat biomass estimates in two-season field study. Scienmag.