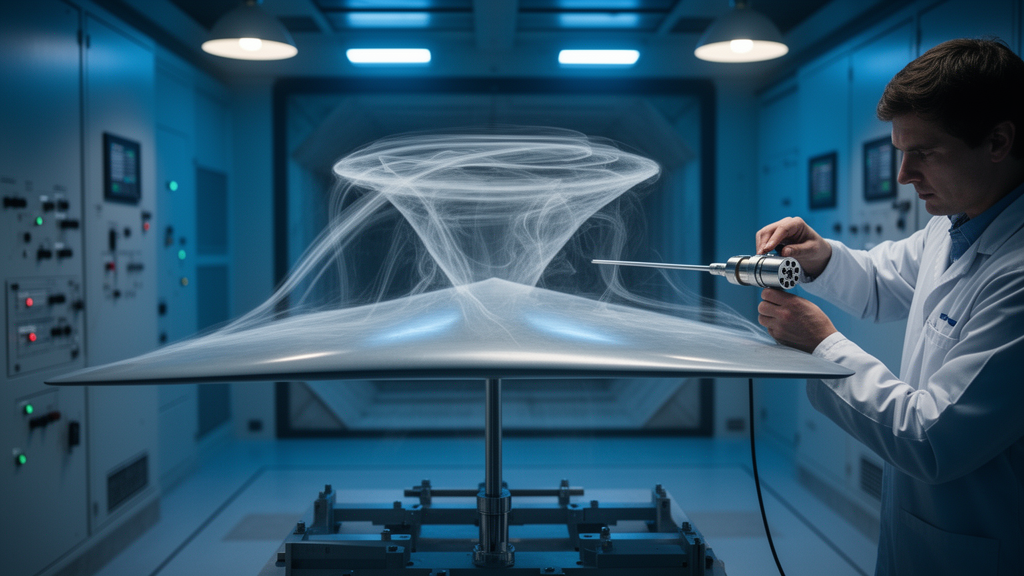
The suction peak on a slender delta wing does not sit directly beneath the leading-edge vortex that produces it. That is the central finding of a new experimental study published in Advances in Aerodynamics, in which researchers combined pressure-sensitive paint and stereoscopic particle image velocimetry to map, in parallel, the surface pressure and the vortex flowfield on a 70-degree swept delta wing. The work quantifies, for what the authors describe as the first systematic treatment in joint PSP-PIV studies on delta wings, how far the pressure minimum wanders from the vortex core and why it wanders farther as angle of attack and Reynolds number rise.
The experiments were carried out in a closed-circuit low-speed wind tunnel at the China Aerodynamics Research and Development Center, in a test section 1.4 meters wide, 1.8 meters high and 4.8 meters long. The model was a flat, sharp-edged triangular plate with a chord of 0.298 meters, a span of 0.216 meters, a thickness of 6 millimeters, a 45-degree windward bevel and the 70-degree sweep that places it firmly in the slender category, defined as sweep angles above 55 degrees. Pressure sensors were mounted in rows at four chordwise stations, and the suction side was coated with pressure-sensitive paint to capture the full pressure footprint at single-pixel resolution.
Two measurement campaigns defined the test matrix. In the first, four freestream velocities between 30 and 60 meters per second were tested at a fixed angle of attack of 25 degrees, covering Reynolds numbers from 0.6 to 1.2 million based on chord. In the second, four angles of attack from 15 to 30 degrees in 5-degree increments were tested at a fixed Reynolds number of 1.2 million. The 25-degree angle was chosen because previous work places the stall angle of a 70-degree delta wing near 35 degrees, so the flow carries strong leading-edge vortices while remaining attached in the sense of pre-stall behavior.
The velocity fields were measured with stereoscopic particle image velocimetry at cross-sections located at 37.5, 50, 62.5 and 75 percent of the chord. Two 6600-by-4400-pixel CCD cameras in an angular displacement arrangement captured all three velocity components, illuminated by a double-pulsed Nd-YAG laser, with DEHS particles seeding the flow. Each averaged dataset combined 20 instantaneous velocity fields recorded at 2 hertz, and the estimated uncertainty of the PIV results is below 2 percent. Surface pressure came from pressure-sensitive paint excited by a 400-nanometer LED and recorded with a 1024-by-1024-pixel camera, calibrated in situ against the pressure sensors to eliminate errors from temperature drift. The paint resolved features at 0.45 millimeters per pixel, and the maximum standard deviation of the PSP measurement was 68.3 pascals at the highest test speed.
The flow physics at stake is classic vortex lift. On the suction side of a slender delta wing, flow separates at the leading edge and rolls up into a pair of counter-rotating leading-edge vortices that generate strong suction and additional lift. At low angles of attack the vortex core carries a jet-like axial flow; at sufficiently high angles the vortex suddenly expands downstream, a phenomenon called vortex breakdown, which is the dominant mechanism of lift loss. Because the off-surface three-dimensional pressure field of these vortices is extremely difficult to measure directly, the team instead studied the footprint the vortices leave on the wing surface, using PSP for the pressure map and PIV for the vortex kinematics.
Tracking both fields quantitatively revealed the mismatch. The researchers extracted dimensionless parameters S1 and S2 for the spanwise and vertical position of the vortex center, and P1 for the spanwise position of the suction peak, all normalized by chord. In the tested conditions the vortex filaments were nearly straight, meaning the flow was conical, with S1 and S2 increasing linearly downstream. The distribution of P1 generally followed S1, but P1 sat consistently slightly farther outboard than the vortex center. The gap between the two lines, representing the suction peak shift, shrank toward the trailing edge but grew overall with increasing Reynolds number, and it widened still more with increasing angle of attack.
The explanation lies in the velocity gradients rather than in the vortex core alone. For classical axisymmetric vortex models such as the Rankine and Lamb-Oseen models, minimum pressure coincides with the vortex center. But a delta-wing leading-edge vortex is fed by the shear layer separated from the leading edge, so the flowfield is dominated by two interacting vortical structures. Taking the divergence of the Navier-Stokes equations shows that velocity gradients are the source of pressure variation, and a further decomposition shows that the rotation rate, dominant in the vortex, and the strain rate, dominant in the shear layer, jointly determine the pressure distribution. The local pressure minimum is therefore expected between the vortex core and the shear layer, shifted by the asymmetric velocity gradient field. As the shear layer weakens downstream, the asymmetry weakens and the shift shrinks, matching the measurements.
The second major result concerns streamwise variation. Because the pressure reconstruction scheme used here works from in-plane PIV data, streamwise velocity gradients were not available to it, so any gap between the reconstructed pressure and the PSP measurement reflects the three-dimensionality of the flow. Near the wing apex, where the vortices grow rapidly, the gap was large; approaching the trailing edge it decreased smoothly for the low-Reynolds and low-angle cases. For the high-Reynolds, high-angle case, the combination of limited streamwise variation and stronger in-plane vortical structures weakened the three-dimensionality of the vortices downstream, making their pressure distribution resemble that of a two-dimensional vortex. By contrast, at 15 degrees the vortices remained concentrated and growing all the way to the trailing edge, keeping three-dimensionality, and the estimation gap, relatively large.
The authors note a practical consequence: where streamwise variation is reduced, simplified quasi-steady or two-dimensional vortex models could serve for preliminary analysis and design at lower computational cost, and active vortex control near the trailing edge might respond more linearly to control inputs, behaving more like a controllable two-dimensional vortex. They also caution that omitting streamwise gradients can underestimate or overestimate pressure magnitude depending on whether those gradients are favorable or adverse, so obtaining all three velocity components matters for accurate pressure estimation of leading-edge vortices.
The broader context is the aerodynamics of small aircraft. Micro air vehicles typically operate at Reynolds numbers of 10,000 to 100,000 and unmanned aerial vehicles between 100,000 and one million, regimes where high viscous drag degrades performance and thin flat or cambered plates outperform thick airfoils because separated flow dominates. The present measurements sit at the upper edge of that range, at Reynolds numbers the authors describe as relevant for practical applications. Circulation estimates showed that the vortices varied more with angle of attack than with Reynolds number, implying more intense vorticity feeding from the shear layer at higher incidence, and the team suggests the findings can inform flow control strategies for slender-delta-wing MAV and UAV configurations.
Subject of Research: Experimental study of leading-edge vortices and surface pressure on slender delta wings using PSP and PIV
Article Title: Investigation of surface pressure and leading-edge vortex of slender delta wings
Article References: Liang, L., Cao, K., Cheng, Y., Yue, T., Shen, X., Gao, Q., & Tu, H. (2026). Investigation of surface pressure and leading-edge vortex of slender delta wings. Advances in Aerodynamics, 8(1), Article 13. https://doi.org/10.1186/s42774-025-00242-3
Image Credits: AI Generated
DOI: 10.1186/s42774-025-00242-3
Keywords: delta wing, leading-edge vortex, pressure-sensitive paint, particle image velocimetry, surface pressure, vortex breakdown, Reynolds number, angle of attack, aerodynamics, unmanned aerial vehicles, vortex lift, wind tunnel
News Source: Denise Maddox. (October 30, 2026). Delta Wing Study Shows Suction Peak Does Not Sit Under the Vortex Center. Scienmag.