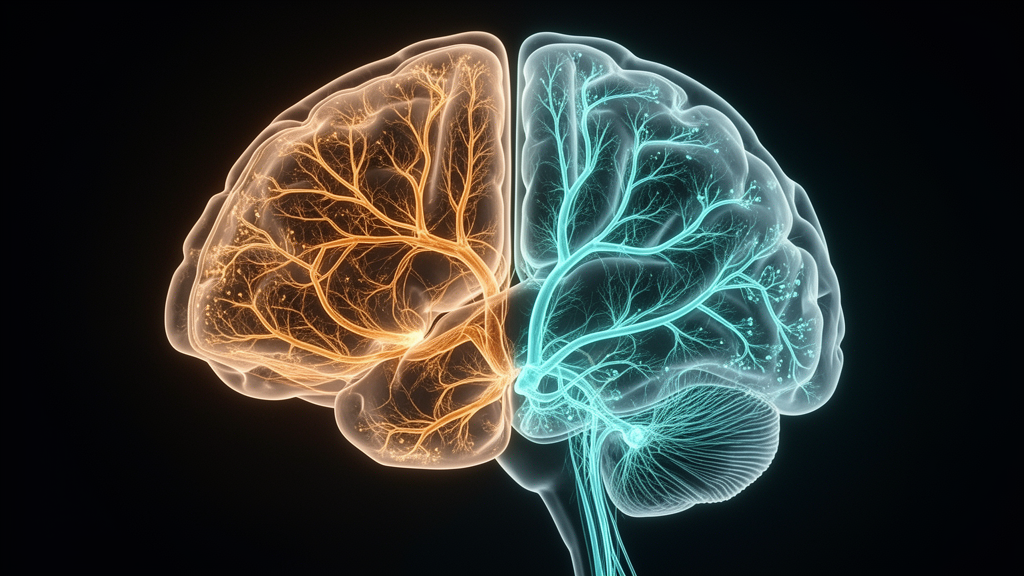
By integrating individual-level morphometric similarity networks derived from high-resolution structural magnetic resonance imaging with a semi-supervised machine learning clustering algorithm, researchers identified two subgroups within a clinical cohort of patients with type 2 diabetes. One subgroup demonstrated widespread increases in network strength alongside relatively preserved cognitive performance, whereas the second subgroup exhibited extensive network degradation accompanied by significantly lower global cognitive scores and nearly double the odds of screening-defined mild cognitive impairment. Crucially, conventional clinical and laboratory measurements of blood glucose, insulin concentration, and metabolic control failed to differentiate between these two groups, indicating that standard glycemic monitoring alone cannot capture the hidden neurobiological heterogeneity that governs cognitive decline in diabetic patients.
Type 2 diabetes mellitus affects hundreds of millions of people worldwide, imposing severe systemic burdens that extend beyond classic vascular and metabolic complications to directly compromise the central nervous system. Epidemiological studies have repeatedly demonstrated that individuals with diabetes face elevated risks of progressive cognitive decline, mild cognitive impairment, and eventual progression to overt dementia, frequently presenting with measurable deficits across memory recall, mental processing speed, attention, and executive functioning. Nevertheless, clinicians have long noted substantial interindividual variability among patients presenting with clinically equivalent glycemic indices: while certain individuals maintain stable cognitive capacity across decades of illness, others suffer debilitating mental decline. Previous neuroimaging studies attempting to identify the anatomical basis of this variation have predominantly relied on conventional case-control comparisons that aggregate all diabetic participants into a single experimental group against healthy controls. This traditional approach averages out divergent pathological processes, yielding inconsistent or conflicting neuroanatomical literature and masking critical individualized patterns of structural disease progression.
To overcome these limitations, the research team analyzed an extensive clinical dataset comprising 490 adult patients diagnosed with type 2 diabetes according to standard American Diabetes Association guidelines alongside 288 healthy control participants. The overall cohort spanned ages from 26 to 75 years, with the diabetic cohort showing a median age of 51.0 years, a 62.4 percent male representation, a median education of 11.0 years, and a median diabetes duration of 60.0 months. All enrolled participants underwent detailed clinical documentation within 24 hours of enrollment, exhaustive laboratory evaluations including five-point oral glucose tolerance tests, comprehensive neuropsychological batteries, and standardized brain imaging. Global cognitive status was rigorously quantified using the Chinese version of the Mini-Mental State Examination and the education-adjusted Beijing version of the Montreal Cognitive Assessment, where mild cognitive impairment was operationally established at a validated threshold score below 26 points. Specific cognitive subdomains were mapped through the Auditory Verbal Learning Test for verbal memory recall, the Trail Making Test and Digit Symbol Substitution Test for processing speed, the Digit Span Test for working memory, and the Grooved Pegboard Test for manual dexterity.
Structural neuroimaging was conducted using a 3.0 Tesla magnetic resonance imaging scanner equipped with a 64-channel head coil to obtain three-dimensional T1-weighted anatomical acquisitions. Image preprocessing was executed through the automated FreeSurfer recon-all computational pipeline, subdividing the cerebral cortex into 308 distinct, approximately equal-sized morphological regions by refining the standard Desikan-Killiany anatomical parcellation atlas. For each individual region, the investigators extracted four cortical morphometric parameters: gray matter volume, surface area, cortical thickness, and mean curvature, omitting Gaussian curvature based on prior methodological validation. To eliminate scaling disparities, morphological values were z-score normalized across cortical parcels before constructing individual morphometric similarity networks. Pairwise Pearson correlation analyses performed across these standardized feature vectors generated comprehensive interregional similarity matrices for each subject. Regional network strength was quantified as the mean weighted correlation coefficient across connecting regions without applying arbitrary binarization thresholds, and regional strengths were subsequently grouped into seven standard canonical cerebral networks defined by the Yeo cortical schema.
To identify genuine disease-associated architectural subtypes rather than arbitrary clusters driven by normative biological variability, the researchers implemented Heterogeneity through Discriminative Analysis, known as HYDRA. Unlike unsupervised clustering algorithms that cluster patients solely based on patient-to-patient similarity, HYDRA operates as a semi-supervised machine learning framework that simultaneously models multidimensional boundaries between diseased participants and healthy control populations while isolating discrete subtypes within the patient cohort. Using regional morphometric similarity network strengths across all 308 cortical parcels as feature inputs, the algorithm adjusted for age, sex, years of formal education, and estimated total intracranial volume within each training fold. Cross-validation testing evaluated solutions ranging from one to eight potential clusters, and stability metrics identified a two-cluster solution as optimal, achieving a high adjusted Rand index of 0.70 across repetitive resampling and split-sample iterations, confirming reproducible clustering that was not driven by methodological noise or model overfitting.
The two resulting neuroimaging phenotypes exhibited stark clinical and cognitive divergences despite their indistinguishable routine diabetic profiles. The first subgroup, designated T2DM1 and comprising 254 participants, presented with a median age of 50.0 years and a screening-defined mild cognitive impairment prevalence of 31.1 percent. In contrast, the second subgroup, labeled T2DM2 and encompassing 236 participants, was slightly older at a median age of 52.0 years and exhibited a markedly elevated mild cognitive impairment prevalence of 44.1 percent. Patients categorized into T2DM2 demonstrated significantly worse performance on the Mini-Mental State Examination than those in T2DM1, although continuous education-adjusted Montreal Cognitive Assessment scores and isolated subtests of memory, processing speed, and motor function showed no significant differences between the two diabetic subgroups. Strikingly, comprehensive biochemical comparisons revealed that fasting plasma glucose, glycated hemoglobin, insulin levels, C-peptide concentrations, homeostatic model assessments of insulin resistance and beta-cell function, and glucose tolerance curves remained statistically identical between T2DM1 and T2DM2.
Regional mapping of structural similarity patterns exposed profound, bidirectional reorganizations across the cerebral cortex when comparing both diabetic phenotypes against healthy controls and against each other. Conversely, patients within the T2DM2 phenotype exhibited widespread structural network deterioration, characterized by significant reductions in morphometric similarity across 90 cortical regions distributed widely throughout frontal, temporal, and parietal lobes, alongside localized increases in 66 regions. When the two diabetic subtypes were directly contrasted, T2DM2 demonstrated significant reductions in network strength relative to T2DM1 across 113 distinct cortical parcels, while exhibiting elevated similarity values across 84 regions localized predominantly within the parietal cortex, confirming that morphological coordination differs sharply across the clinical spectrum of diabetes.
Examining these morphometric alterations at the systems level across canonical Yeo functional networks clarified the divergent anatomical signatures defining each subtype. In T2DM1, network-level morphometric similarity was significantly elevated relative to healthy controls across the somatomotor, ventral attention, limbic, and default mode networks, while showing an isolated significant reduction within the visual network. By contrast, T2DM2 displayed an inverted structural pattern, showing significantly heightened similarity within the visual network but pronounced, widespread decreases across the somatomotor, ventral attention, limbic, and default mode networks compared to controls. Multivariable logistic regression modeling established that the visual network, somatomotor network, and ventral attention network served as the primary statistical drivers distinguishing the two subtypes. Specifically, increased visual network strength was associated with dramatically higher odds of T2DM2 classification, whereas preserved or increased strength within the somatomotor and ventral attention networks strongly predicted membership in the cognitively preserved T2DM1 subtype.
The clinical relevance of these network-level architectural variations became particularly evident when evaluating individual cognitive outcomes through multivariable logistic regression adjusted for participant age, sex, and educational attainment. Across the entire diabetic cohort, membership in the T2DM2 neuroimaging subtype was associated with an adjusted odds ratio of 1.91 for screening-defined mild cognitive impairment compared to T2DM1. Conversely, within this same subgroup, lower network strength in the frontoparietal control and ventral attention networks was associated with decreased odds of impairment. Continuous regression models confirmed that higher limbic network strength robustly correlated with higher Montreal Cognitive Assessment scores across multiple sequential models adjusting for demographic, cardiovascular, lifestyle, and disease duration variables.
Linear regression analyses exploring metabolic indices further demonstrated that systemic glycemic stress interacts with cerebral morphology in distinct, network-dependent patterns across the two neuroimaging phenotypes. Within T2DM1, visual network strength correlated positively with glycated hemoglobin, two-hour post-challenge glucose, and peak blood glucose, while ventral attention and default mode network strengths correlated negatively with these same hyperglycemic measures. Within T2DM2, significant associations emerged between reduced limbic network strength and elevated glycated hemoglobin levels. Exploratory statistical mediation analyses using non-parametric bootstrap resampling indicated that limbic network alterations in T2DM2 partially mediated the indirect relationship linking chronic hyperglycemia to poorer global cognitive performance on the Montreal Cognitive Assessment, whereas ventral attention network strength mediated indirect metabolic effects within T2DM1. However, the authors explicitly emphasized that these mediation effects did not survive rigorous false discovery rate corrections across multiple testing parameters and must therefore be considered exploratory rather than conclusive.
To guarantee that these clustering patterns and clinical associations were not artifacts of demographic imbalances or statistical methodology, the investigators conducted extensive sensitivity testing. Using propensity score matching, the team generated a balanced subcohort matching diabetic patients and healthy controls on age, sex, and years of education, successfully verifying that the identified HYDRA subtypes and their corresponding morphometric network configurations persisted without attenuation. Independent split-half analyses dividing the cohort into random halves confirmed cluster stability, while separate subtype analyses run independently on the left and right cerebral hemispheres validated anatomical consistency across both halves of the brain.
Despite the substantial clinical insights provided by these findings, several critical methodological limitations must be considered when interpreting the study. Because the investigation utilized a cross-sectional observational design, no definitive conclusions can be drawn regarding temporal sequences, longitudinal progression, or causal mechanisms linking metabolic dysfunction, morphometric similarity reorganization, and cognitive impairment. In addition, the imaging protocol relied exclusively on structural T1-weighted acquisitions to compute morphometric networks across four features, omitting Gaussian curvature and lacking complementary functional MRI or diffusion tensor imaging modalities that could illuminate physiological connectivity and microstructural white matter tract integrity. Furthermore, because oral glucose tolerance testing was retrospectively retrieved from inpatient medical records, exact timings regarding the withholding of routine antidiabetic medications prior to testing were not systematically standardized. Future prospective longitudinal studies examining independent multicenter cohorts will be necessary to establish whether these imaging-derived phenotypes can reliably predict future dementia risk in clinical practice.
Subject of Research: Brain morphometric similarity network subtypes and mild cognitive impairment in type 2 diabetes
Article Title: Distinct brain morphometric similarity network phenotypes are associated with mild cognitive impairment in type 2 diabetes mellitus
Article References: Yue, X., Dai, Z., Qiu, Z., Qiu, S., & Li, G. (2026). Distinct brain morphometric similarity network phenotypes are associated with mild cognitive impairment in type 2 diabetes mellitus. Frontiers in Endocrinology, 17, Article 2014196. https://doi.org/10.3389/fendo.2026.2014196
Image Credits: AI Generated
DOI: 10.3389/fendo.2026.2014196
Keywords: type 2 diabetes, mild cognitive impairment, morphometric similarity networks, HYDRA machine learning, neuroimaging subtypes, structural MRI, limbic network, visual network, somatomotor network, ventral attention network, Montreal Cognitive Assessment, Mini-Mental State Examination, cortical morphology, glycated hemoglobin, FreeSurfer, cognitive decline, metabolic dysfunction
News Source: Cassandra Pierce. (November 12, 2026). Brain Network Subtypes Reveal Contrasting Cognitive Impairment Risks in Diabetes. Scienmag.