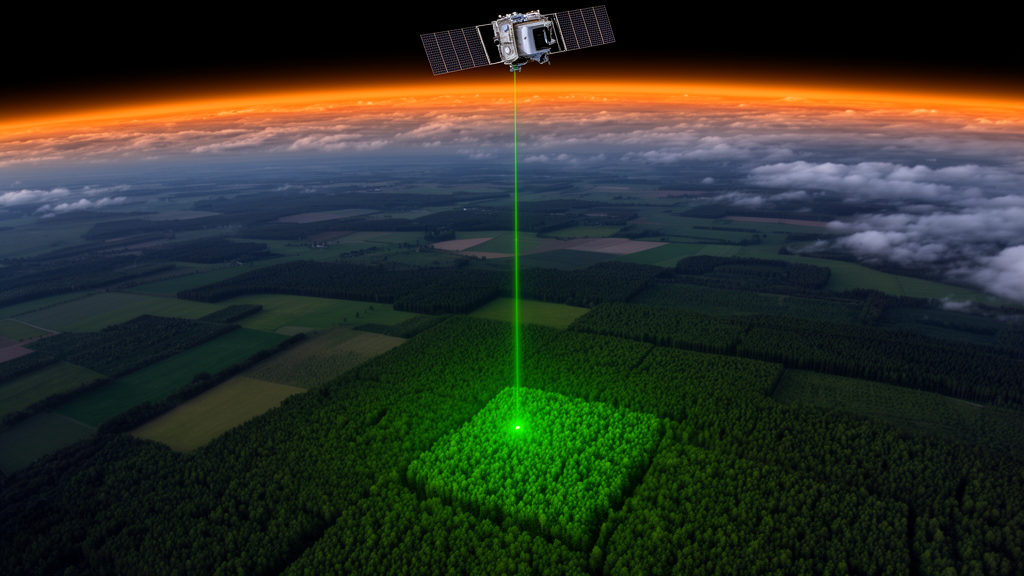
Forest managers in charge of a few thousand hectares have long faced a frustrating gap: national forest inventories produce trustworthy numbers for whole countries and regions, but the field plots become too sparse to say much with confidence about a single management unit. A new study in Annals of Forest Science shows that combining the spaceborne laser of NASA’s Global Ecosystem Dynamics Investigation (GEDI) with French National Forest Inventory (NFI) data can close much of that gap, delivering precision gains of more than 50 percent across all tested domains in eastern France.
The research, led by Irene Chiagozielam Onwunji and colleagues, was conducted in the Région Bourgogne-Franche-Comté, a roughly 45,000 square kilometre region along the France–Switzerland border that includes the Jura Mountains, where elevations climb from foothills to peaks above 1,700 metres. The team focused on public forests, which make up about 40 percent of the region’s forest area and cover 719,251 hectares, ranging widely in size with an interquartile range of 40 to 221 hectares and the largest state forest, Chaux, spanning 13,068 hectares.
The domains for estimation were drawn from the administrative hierarchy of the Office National des Forêts (ONF), which manages French public forests. The researchers analysed six Agencies (AGs), large spatial divisions with mean areas of about 120,000 hectares, and 51 Territorial Units (UTs), the primary operational scale at which management plans are implemented, with mean areas of roughly 14,400 hectares. It is precisely at this UT level that the French NFI’s sampling intensity falls short, creating what the authors describe as a significant information gap for local managers.
To build the statistical machinery, the team drew on 5,591 field plot observations from the French NFI between 2019 and 2022, aggregated into five forest attributes: quadratic mean diameter, basal area, volume, basal area production, and volume production, the latter two including both increment and ingrowth derived from 5-year increment cores. Because the NFI samples independent plots each year, the researchers treated each year as an independent replicate of the domains. Plot availability varied sharply: the six AGs had 39 to 216 plots per year, while the 51 UTs had as few as 2 to 45 plots per year, exactly the sparse-data regime where conventional design-based estimates become unreliable.
The auxiliary data came from GEDI, a LiDAR instrument aboard the International Space Station that has been measuring vertical vegetation structure globally since 2019 within 51.6 degrees north and south latitude. Each of its eight beams produces footprints roughly 25 metres in diameter spaced 60 metres apart along track. The team used the Level 2A product, which provides Relative Height (RH) metrics from RH0 to RH100 describing the percentiles of cumulative waveform energy, along with ground elevation. After quality filtering and the removal of footprints with canopy heights above 65 metres as likely outliers, 593 orbits covered the study area over the four-year period.
Crucially, the researchers did not try to match individual laser footprints to individual field plots, a pairing that is rarely possible because NFI plot coordinates are deliberately blurred for confidentiality. Instead they used an area-level Fay-Herriot model, a small area estimation technique that combines design-based direct estimates with model-based predictions built from domain-level auxiliary data. GEDI footprints and NFI attributes were aggregated within each AG or UT, and the resulting domain-level means and standard deviations of elevation and RH metrics served as predictors. Variable selection by best subset regression, capped at three predictors and adjusted to avoid multicollinearity among highly correlated height metrics, left RH98mean, a proxy for maximum canopy height, as the most consistently selected predictor, appearing in nine of the ten final models.
The results were unambiguous. Relative efficiency, the ratio of the sampling variance of direct estimates to the mean squared error of the model-based estimates, exceeded 1 for all forest attributes and was always above 4 for the AG domains. Model fit was stronger at the coarser AG scale, with R² values between 0.75 and 0.82, while the finer UT models yielded R² values of 0.46 to 0.72. Precision gains exceeded 50 percent across all domains, and the largest gains clustered where field data were scarcest: up to 16 UT domains in the eastern part of the study area, where sampling was most sparse, showed relative efficiency values above 3.
The practical payoff showed up most clearly in the operational precision benchmarks. Using a target relative standard error of 15 percent for productivity attributes, the researchers found that only 43.1 percent of UT domains met the threshold for basal area production and just 31.4 percent for volume production with direct estimates alone. After the Fay-Herriot model was applied, every UT domain fell well below the threshold for basal area production, and 43 of 51 domains, or 84.3 percent, did so for volume production. In the AG domains, where direct estimates were already precise with relative standard errors of roughly 4 to 9.5 percent, the model narrowed those distributions further, to 1.8 to 3.3 percent for basal area production and 2.7 to 4.4 percent for volume production.
On the temporal side, the model tracked basal area and volume production year by year from 2019 to 2022 while remaining statistically consistent with a baseline that pooled all four years, indicating no significant interannual deviations beyond estimation uncertainty. The authors caution that a four-year series is too short to detect emerging changes, and that early signals of productivity shifts may be spatially localized and thus invisible at coarse scales. They also note limitations: the model-dependent Fay-Herriot estimator is vulnerable to bias if the linking model is misspecified, the univariate models do not preserve additivity among correlated attributes, and strongly managed landscapes with clear-cutting or heavy thinning could weaken the relationship between the laser metrics and field estimates. As the GEDI mission continues beyond 2025, longer time series combined with drought indices could reveal trends that this initial snapshot could not.
Subject of Research: Using GEDI spaceborne LiDAR with national forest inventory data in Fay-Herriot small area models to improve forest productivity estimates at management-unit level in eastern France
Article Title: Leveraging GEDI and NFI to inform on forest productivity at the level of the management units
Article References: Onwunji, I. C., Vega, C., Durrieu, S., Korhonen, L., Tokola, T., Massey, A., Cordonnier, T., Bouriaud, O., Besic, N., Behloul, S., & Renaud, J.-P. (2026). Leveraging GEDI and NFI to inform on forest productivity at the level of the management units. Annals of Forest Science, 83(1), Article 46. https://doi.org/10.1186/s13595-026-01358-2
Image Credits: AI Generated
DOI: 10.1186/s13595-026-01358-2
Keywords: GEDI, LiDAR, national forest inventory, small area estimation, Fay-Herriot model, forest productivity, basal area production, volume production, France, forest management, remote sensing, ONF territorial units
News Source: Alan Morgan. (October 29, 2026). Spaceborne Laser and National Forest Data Sharpen Productivity Maps for Small Forest Units. Scienmag.