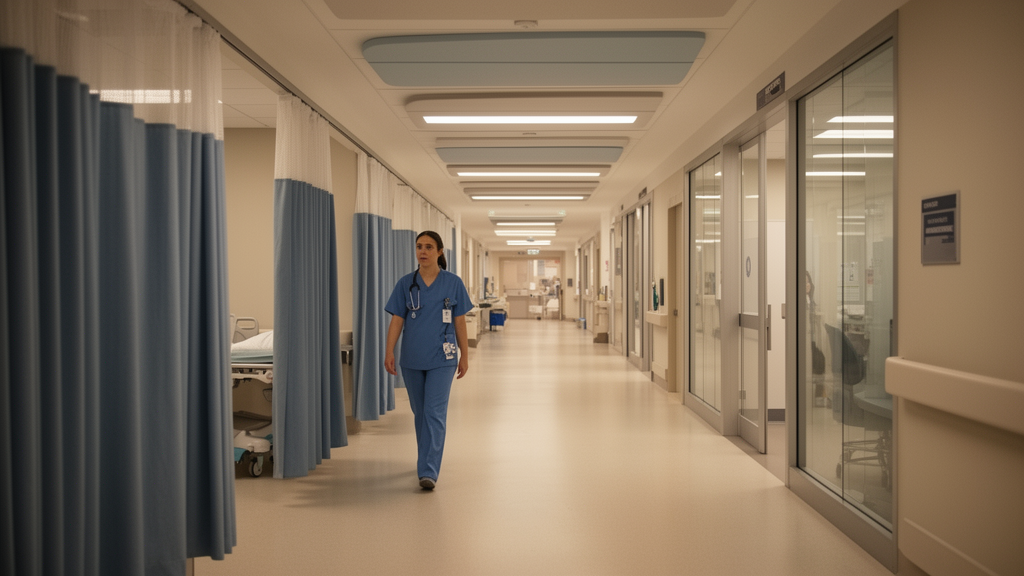
Emergency departments are among the loudest places in any hospital, and a new study argues that the layout of the department itself may be one of the most powerful levers for quieting them. Researchers at a large tertiary teaching hospital in a South Asian metropolitan area combined continuous acoustic monitoring, occupant surveys, geometric spatial analysis and finite-element acoustic simulation to test whether simple, plan-based indicators could flag noisy zones before a facility is ever built. Their results, published in Discover Civil Engineering, show measured noise levels consistently above reference thresholds in all four zones studied, very strong within-sample associations between three newly proposed spatial indices and measured noise, and simulated reductions of up to 7.8 dB(A) from layout modifications alone.
The study took place at the emergency department of a 1,200-bed tertiary teaching hospital that receives roughly 95,000 emergency visits each year. The department occupies 3,840 square metres on a single floor and contains 24 functional zones, of which four representative areas were selected for detailed investigation: a 380-square-metre Triage Area with high openness and reception counters, a 640-square-metre Waiting Hall with large undifferentiated fixed seating, a 210-square-metre central Nurses’ Station in a semi-open configuration, and a 520-square-metre Treatment Corridor with treatment bays on either side. The research received institutional ethics approval, and all survey participants gave informed consent.
Acoustic monitoring was carried out over 20 consecutive weekdays, covering 480 elapsed hours, using calibrated Class-1 integrating sound level meters placed at three positions per zone, at a height of 1.2 metres, away from walls and reflecting surfaces. The meters recorded equivalent continuous sound pressure levels over 24 hours, percentile noise levels, peak sound pressure levels and one-third-octave band spectra between 63 Hz and 8 kHz. Measured 24-hour equivalent levels ranged from 62.2 dB(A) in the Treatment Corridor to 67.0 dB(A) in the Triage Area, exceeding the study’s 60 dB(A) reference threshold in every zone and also surpassing the 55 dB(A) comparison value drawn from the Chinese environmental noise standard GB 3096-2008. Percentile levels exceeded for 10 percent of the time ranged from 66.9 to 72.1 dB(A), and background levels remained between 53.4 and 58.2 dB(A) even during quiet periods. During high-acuity patient events, peak instantaneous levels reached as high as 94.3 dB(A) in the Triage Area. The 24-hour profiles showed two distinct peaks, one between 09:00 and 11:30 and a second between 15:00 and 17:30, coinciding with morning and afternoon surges in patient flow, while even the overnight minimum between 03:00 and 05:00 left zone averages of 52 to 58 dB(A), still well above hospital noise benchmarks.
Alongside the measurements, the team surveyed 312 respondents, 174 healthcare professionals and 138 patients and visitors, using a structured bilingual questionnaire with validated scales adapted from established noise sensitivity and hospital noise instruments. The instruments were pretested on 30 participants and showed acceptable internal consistency. Respondents identified patient and visitor conversation as the most prevalent noise source at 37.9 percent, followed by broadcast announcements over the public address system at 21.4 percent, medical equipment alarms and operation at 14.6 percent, staff communication at 11.8 percent, footsteps and door noise at 8.2 percent, and HVAC and other mechanical sources at 6.1 percent. The two groups differed in their attributions: healthcare workers most frequently named broadcast announcements, while patients and visitors most often cited conversation-related noise, at 48.2 percent. The authors argue that this divergence matters for intervention design, because a strategy targeting only one group’s dominant irritant would under-serve the other, and they framed their combined intervention scenario as addressing both perception profiles.
The core methodological contribution is a set of three spatial indices computed from dimensioned architectural drawings and site measurements. The Openness Index is the ratio of unobstructed horizontal open area to total floor area, ranging from 0 for fully enclosed spaces to 1.0 for completely open ones, with obstructions defined as permanent walls, built clinical equipment and furniture taller than 1.5 metres. Flow Density is the average number of persons per square metre of floor area during peak operational hours, based on 30-minute interval headcounts on 10 randomly selected days during morning and afternoon peaks. The Zoning Index is the number of acoustically differentiated sub-zones, separated by walls, partitions or level changes with at least 20 dB insertion loss, divided by the total number of functional activity clusters, ranging from 0 for no acoustic separation to 1.0 for full separation. The indices are intended to operate at the schematic design stage, when only a floor plan and an anticipated occupancy pattern exist, feeding into rather than replacing the verification measurements required by international acoustic standards once construction is complete.
When the four zone-level index values were correlated with measured equivalent sound levels, the associations were strikingly strong. The Openness Index correlated with Leq at r = 0.996, Flow Density at r = 0.997, and the Zoning Index at r = −1.000, with p-values of 0.004, 0.003 and below 0.001 respectively, and corresponding R-squared values of 99.2, 99.4 and 100.0 percent within the sample. The pattern followed a clear gradient: the Triage Area had the highest openness, the highest reported flow density and the lowest zoning score, along with the highest noise level, while the Treatment Corridor showed moderate openness, moderate density and the highest zoning score alongside the lowest noise level. The authors are emphatic, however, that with only four zones these statistics describe the displayed dataset rather than an externally validated predictive model. With so few data points, Pearson coefficients are highly sensitive to the position of any single zone, the confidence intervals are wide, and the correlations cannot rule out confounding by unmeasured factors such as patient acuity mix or staffing levels.
To test whether layout changes could actually reduce noise, the team built three-dimensional geometric models of each zone from verified architectural drawings and ran finite-element acoustic simulations in COMSOL Multiphysics 6.0, using laboratory-measured absorption coefficients for concrete, vinyl flooring, acoustic ceiling tile and glazing, with noise sources represented as spherically radiating point sources based on field recordings. The model was validated against measured sound levels with a mean absolute error of 1.8 dB(A) and an r-squared of 0.94, and mesh independence and one-at-a-time sensitivity checks on ceiling absorption and source power produced spreads well within that validation error. Four intervention scenarios were modelled. Enclosing the open triage counter into individually screened bays lowered simulated Leq by 4.2 dB(A) in the Triage Area. Dividing the Waiting Hall into three acoustically separate sub-zones with full-height partitions of at least 2.4 metres reduced levels by 3.6 dB(A). Replacing the central public address system with zone-specific directional speakers cut the PA contribution to noise in adjacent patient areas by 6.3 dB(A). The compound intervention combining all three measures achieved the largest simulated reduction, 7.8 dB(A) in the Triage Area and 5.4 to 6.2 dB(A) in other high-noise zones.
Those simulated gains compare favourably with the 2 to 5 dB(A) reductions typically reported for post-construction surface treatments such as sound-absorbing ceiling tiles, cubicle curtains, white noise masking and behavioural noise-awareness programmes, which the authors note address sound energy after it has already been generated and propagated, and which face infection-control constraints on porous materials in emergency settings. The paper situates its findings within a broader literature documenting consistently elevated noise in emergency departments worldwide, including reported averages of 72.4 dB(A) with peaks near 99.7 dB(A) in a North American ED and systematic review ranges of 58.6 to 78.2 dB(A) internationally. Prior research has linked excessive noise to higher pain perception, elevated cortisol, sleep disturbance, communication difficulties and satisfaction losses, and the authors caution that these broader health associations provide context but were not directly measured in the present four-zone study.
The practical promise of the framework is that architects and healthcare planners can compute all three indices directly from floor plans and occupancy estimates, without specialist acoustic equipment, to compare layout options, flag high-risk zones such as open triage counters or undivided waiting halls, and prioritise interventions before construction decisions are finalised. Within the four-zone dataset, lower openness, lower peak-hour flow density and higher zoning scores were associated with equivalent levels below roughly 63 dB(A), values the authors stress are preliminary sample-derived screening thresholds rather than validated universal criteria. The study’s limitations are substantial and acknowledged in detail: a single facility, four zones, simplified source models, no fully coupled multi-parameter uncertainty analysis, no expert validation of the scoring procedure, and no evaluation of intervention cost or feasibility. The authors call for validation across larger and more diverse emergency department samples, integration into building information modelling workflows, and post-occupancy acoustic measurements in refurbished facilities to confirm whether the simulated benefits translate into real-world quieter emergency departments.
Subject of Research: Spatial layout indicators and acoustic simulation for noise reduction in emergency department design
Article Title: Optimizing emergency department layouts for noise reduction using spatial performance indicators and acoustic simulation
Article References: Ojha, D., Srivastava, R. K., & Ojha, L. (2026). Optimizing emergency department layouts for noise reduction using spatial performance indicators and acoustic simulation. Discover Civil Engineering, 3(1), Article 261. https://doi.org/10.1007/s44290-026-00647-z
Image Credits: AI Generated
DOI: 10.1007/s44290-026-00647-z
Keywords: emergency department, noise pollution, acoustic simulation, hospital design, spatial indices, Openness Index, Flow Density, Zoning Index, COMSOL Multiphysics, triage area, healthcare architecture, sound pressure level
News Source: Denise Maddox. (October 29, 2026). Emergency Department Layouts Could Cut Noise by Nearly 8 Decibels, Simulation Study Finds. Scienmag.