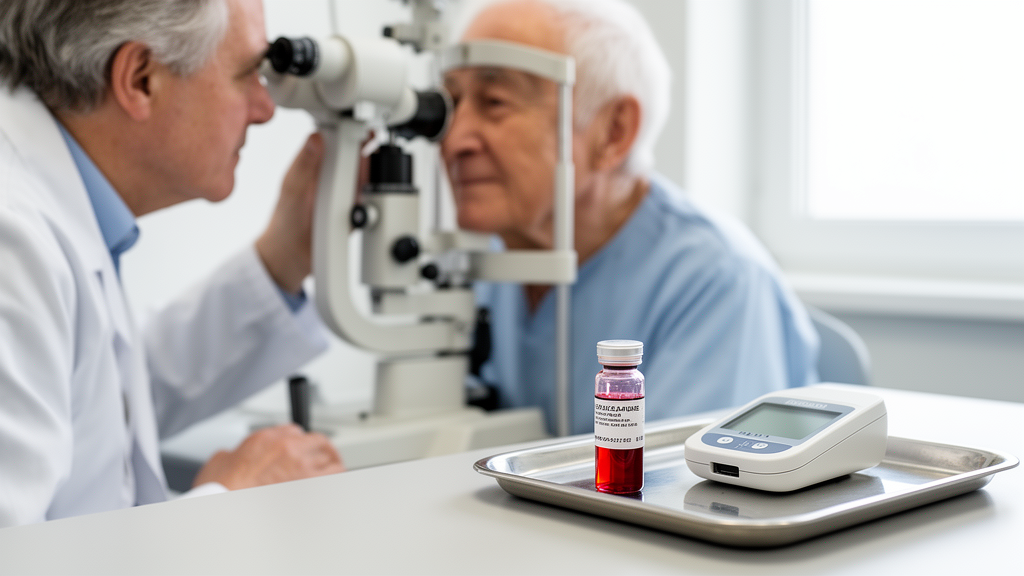
People with higher levels of a simple blood-based measure of metabolic health appear to face an elevated risk of developing glaucoma, according to a large prospective study drawing on nearly 400,000 adults in the United Kingdom. The measure, known as the triglyceride-glucose index, combines two routinely measured blood values into a single number that reflects insulin resistance, a state in which the body’s tissues respond poorly to the hormone insulin. When the index was combined with measures of central body fat such as waist circumference, the association with later glaucoma diagnosis became notably stronger, suggesting that the metabolic burden carried in the torso may matter as much as what circulates in the bloodstream.
The study, published in the journal Eye and Vision, followed 396,213 participants of European ancestry who were free of glaucoma at the start of the observation period. Baseline data came from the UK Biobank recruitment years of 2006 to 2010, when blood samples were collected and stored and height, weight, waist circumference, and hip circumference were measured directly. Over a mean follow-up of just over eight years, 6,957 participants received a first diagnosis of glaucoma, identified through self-report, records of glaucoma surgery or laser treatment, or linked hospital diagnostic codes. The researchers then asked whether the triglyceride-glucose index and four related composite measures predicted who would develop the disease.
The triglyceride-glucose index, first proposed in 2010, is calculated as the natural logarithm of fasting triglycerides multiplied by glucose, divided by two. It has gained traction as an inexpensive surrogate for insulin resistance because it performs well against the euglycemic hyperinsulinemic clamp, the laboratory gold standard that is too cumbersome for routine clinical use. In this study, the investigators also multiplied the index by body mass index, waist circumference, waist-to-height ratio, and waist-to-hip ratio, producing four adiposity-integrated variants intended to capture the combined influence of circulating glucose and lipids and the distribution of body fat.
In fully adjusted statistical models that accounted for age, sex, socioeconomic and lifestyle factors, and cardiovascular and metabolic conditions, each one-standard-deviation increase in the triglyceride-glucose index was associated with a five percent higher hazard of incident glaucoma, with a hazard ratio of 1.05 and a 95 percent confidence interval of 1.02 to 1.08. The composite indices showed larger effects. The waist circumference version carried a hazard ratio of 1.30 per standard deviation increase, the waist-to-height version 1.26, the body mass index version 1.20, and the waist-to-hip version 1.16. All of these estimates were statistically significant after correction for multiple testing using the false discovery rate method.
One of the more striking findings was the shape of the relationship. Rather than rising steadily with the index, glaucoma risk followed a U-shaped curve. Participants with index values below 8.5 or above 8.7 showed increased risk, while the narrow band between 8.5 and 8.7 corresponded to the lowest estimated hazard. The authors caution against reading this as a clinically safe target range. They note that low values of the index may reflect frailty, undernutrition, chronic illness, or medication use rather than a directly protective metabolic state, and they emphasize that the non-linear pattern requires replication in independent populations before any clinical interpretation is attempted.
The observational findings were complemented by a Mendelian randomization analysis, a genetic technique that uses naturally occurring variation in DNA to probe whether an exposure may causally influence an outcome. The researchers selected 55 independent genetic variants strongly associated with the triglyceride-glucose index from a genome-wide association study of more than 273,000 UK Biobank participants without diabetes or dyslipidemia. In the primary inverse-variance weighted analysis, genetically predicted higher index values showed a nominal association with glaucoma, corresponding to an odds ratio of 1.27 with a confidence interval of 1.00 to 1.62 and a p value of 0.046. However, the alternative statistical methods used as sensitivity checks did not reach significance, and the genetic instruments showed heterogeneity in their effects. The authors therefore describe the genetic evidence as suggestive rather than conclusive.
The study also examined how the metabolic indices related to measurable eye characteristics. Linear regression showed that higher index values were positively associated with corneal-compensated intraocular pressure, but the effect was small: each standard deviation increase corresponded to only about 0.053 to 0.095 millimeters of mercury. When the fully adjusted models were further adjusted for intraocular pressure, the associations of the composite indices with glaucoma persisted, with hazard ratios of 1.07 for the body mass index version, 1.09 for the waist circumference version, and 1.11 for the waist-to-height version. Mendelian randomization mediation analysis likewise did not support intraocular pressure as a major pathway, finding no significant genetic association between the index and pressure. This points toward mechanisms that operate independently of the eye’s fluid pressure, the factor that current glaucoma therapy targets almost exclusively.
Optical coherence tomography measurements added another dimension. Higher index values were inversely associated with the thickness of most retinal layers, with the strongest negative association observed for macular thickness, although the proportion of variance explained was low and the authors urge cautious interpretation. The indices also correlated with systemic biomarkers, showing positive associations with alanine aminotransferase, C-reactive protein, gamma-glutamyl transferase, and urate, and negative associations with sex hormone-binding globulin, vitamin D, and docosahexaenoic acid. These patterns are consistent with a profile of low-grade inflammation and altered liver metabolism accompanying insulin resistance.
A machine-learning model built with the extreme gradient boosting algorithm demonstrated that the indices could contribute to risk prediction. The authors are explicit that these figures reflect discrimination within the UK Biobank data alone and that external validation, calibration assessment, and decision curve analysis are needed before any clinical use. They frame the indices as potential adjunctive indicators for risk stratification rather than standalone screening or diagnostic tools, given the modest effect size of the index alone.
Several limitations shape how the results should be read. The cohort consisted predominantly of middle-aged and older adults of European ancestry, limiting generalizability to other populations. Glaucoma ascertainment relied on self-report, procedure records, and hospital codes rather than standardized ophthalmic examination of every participant, so outcome misclassification is possible, and the subdivision into primary open-angle and primary angle-closure glaucoma is particularly uncertain because gonioscopy was not uniformly available. Residual confounding, detection bias arising from more frequent healthcare contact among people with metabolic disorders, and the use of only baseline metabolic measurements all temper the conclusions. Subtype analyses suggested the associations may differ between glaucoma types, with non-linear patterns appearing for angle-closure disease but not open-angle disease, though these comparisons are exploratory. The authors propose that glucose-lipid metabolic dysfunction and central adiposity may contribute to glaucoma susceptibility through vascular dysregulation, chronic inflammation, oxidative stress, and mitochondrial impairment affecting the metabolically demanding retinal ganglion cells, and they call for studies with repeated metabolic measurements, standardized eye phenotyping, and diverse populations to determine whether modifying these metabolic markers can actually reduce the risk of a disease that is projected to affect 111.8 million people worldwide by 2040.
Subject of Research: The association of triglyceride-glucose metabolic indices with incident glaucoma risk in the UK Biobank
Article Title: Association between triglyceride-glucose indices and incident glaucoma: integrated UK Biobank and Mendelian randomization study
Article References: Xu, J., Gao, Y., Yu, J., Xu, Z., Zhang, Y., Pang, C. P., Tham, C. C., Yam, J. C., & Chen, L. J. (2026). Association between triglyceride-glucose indices and incident glaucoma: integrated UK Biobank and Mendelian randomization study. Eye and Vision, 13(1), Article 43. https://doi.org/10.1186/s40662-026-00516-x
Image Credits: AI Generated
DOI: 10.1186/s40662-026-00516-x
Keywords: glaucoma, triglyceride-glucose index, insulin resistance, UK Biobank, Mendelian randomization, intraocular pressure, central adiposity, retinal nerve fiber layer, metabolic dysfunction, risk stratification, cohort study, XGBoost
News Source: Daisy Hatcher. (October 28, 2026). Metabolic Blood Index Linked to Higher Glaucoma Risk in Large UK Cohort. Scienmag.