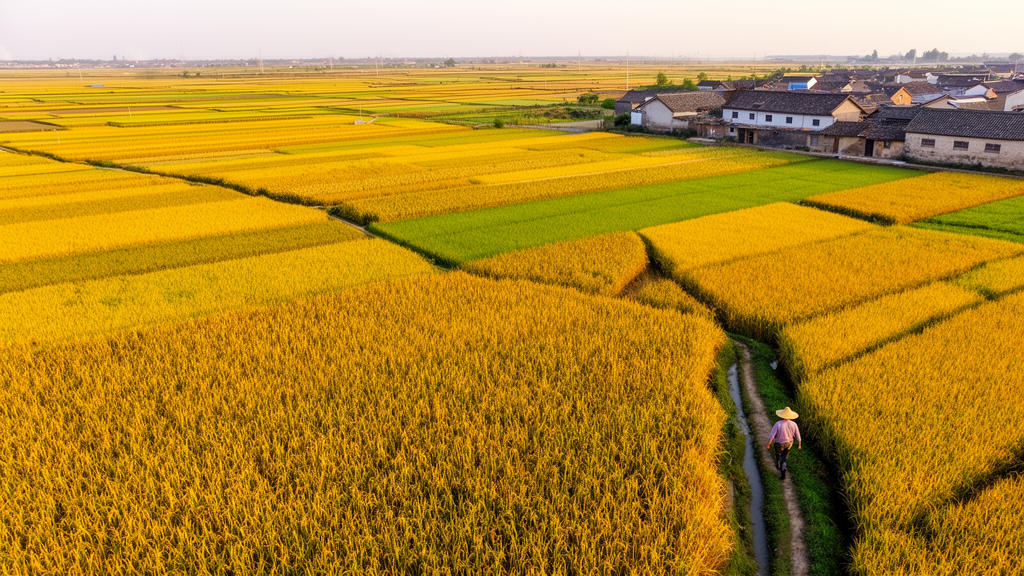
China grows more maize than any country except the United States, supplying roughly 26 percent of the world’s output from fields that are often tiny, terraced, and wedged between villages, roads, and forests. For decades, that fragmentation has been the enemy of accurate mapping. Global crop production datasets typically resolve the planet in grids of 10 kilometers or coarser, a scale at which the spectral signal of a single maize field is hopelessly diluted by everything around it. Now, researchers report the construction of a 30-meter-resolution maize production map for China, called CMP30m, covering 2019 and 2020, built by combining cloud-based satellite processing with official provincial statistics. The work, published as a peer-reviewed study, demonstrates that production can be mapped at the scale of individual fields without a single new field survey.
The team’s central insight was methodological rather than observational. Instead of trying to predict production from scratch using machine learning, which demands vast libraries of ground-truthed yield data that simply do not exist for China’s smallholder landscapes, the researchers adopted a spatial downscaling strategy. The approach traces back to a framework in which satellite-derived net primary production, or NPP, serves as a spatial weighting scheme: national or regional yield statistics are distributed across grid cells in proportion to how much vegetation each cell actually grew. The original version of that idea operated at roughly 55-kilometer resolution. The new study pushed the same logic down to 30 meters by rebuilding every input layer at field scale.
Four upgrades made the difference. First, rather than estimating the fraction of each coarse pixel planted with maize, the model used dynamically updated, annual 30-meter maize distribution maps from the China Crop Dataset–Maize, a product validated against 54,281 field samples and 100 county-level statistics with an overall accuracy of 80.06 percent. Second, the researchers processed Harmonized Sentinel-2 surface reflectance on the Google Earth Engine platform, computing the normalized difference vegetation index at 30 meters from the red and near-infrared bands, which yields a far purer spectral signal for individual maize fields than sensors such as MODIS or AVHRR can provide. Third, a 30-meter maize phenology dataset, verified against 19 agrometeorological stations with correlations of 0.96 for the start of season and 0.82 for the end of season, allowed the growing season to be defined pixel by pixel rather than averaged across an entire coarse grid cell. Fourth, official provincial production totals were allocated directly to pixels according to each pixel’s share of provincial NPP, guaranteeing that the fine-scale map aggregates back to the published statistics.
The computational pipeline itself is a hybrid of two Google services. Google Earth Engine handled the heavy lifting of retrieving Sentinel-2 image collections, masking clouds with a probability threshold of 65 percent, and generating vegetation index composites. Because Earth Engine imposes memory and execution-time limits on iterative operations, the core disaggregation algorithms ran in the Google Colab environment. Cloud gaps in the 5-day-revisit imagery were filled by linear interpolation within a 10-day window, and the year was then divided into consecutive 15-day intervals, with the latest cloud-free NDVI value in each interval retained. Solar radiation came from the ERA5-Land reanalysis at roughly 10-kilometer resolution, resampled to 30 meters by nearest-neighbour interpolation, a step the authors explicitly note does not create true 30-meter radiation information.
From those inputs, the model estimated the fraction of photosynthetically active radiation absorbed by the canopy, converted it into a green leaf area index, and then computed NPP using a radiation use efficiency of 39 for maize, a maximum leaf area index of 3, and a light extinction coefficient of 0.65, values drawn from established crop modeling literature. The 15-day NPP values were accumulated over each pixel’s phenology-defined growing season, summed provincially, and used as the allocation weight: each pixel received provincial production in proportion to its cumulative NPP. The authors acknowledge that these simplified parameters introduce uncertainty, since nationwide field-measured values are unavailable, but sensitivity tests showed that varying the maximum leaf area index to 4.5 or 6 redistributed only about 0.5 to 0.6 percent of production among counties within three agro-ecologically diverse provinces, because the top-down normalization buffers uniform parameter changes.
Validation against independent county-level statistics, compiled from 15 major maize-producing provinces with 1,056 valid counties in 2019 and 1,088 in 2020, showed strong agreement. Correlation coefficients reached approximately 0.88 in both years, regression slopes were close to 1, and the root mean square error held steady at 0.11 million tons with a mean absolute error of 0.05 million tons. The relative root mean square error, at 88.4 and 84.9 percent, is mathematically inflated by the many counties with extremely small production baselines, a recognized statistical artifact in macro-scale gridded crop datasets. A sensitivity analysis revealed a clear non-linear pattern: accuracy, defined as the share of counties with relative error within 30 percent, rose sharply from about 40 to 65 percent as the production threshold increased from zero to 0.3 million tons, fluctuated in the medium range, and stabilized near 100 percent for counties producing more than 1.5 million tons. The model is therefore most reliable in China’s core granaries, including the Northeast Plain and the North China Plain, and least reliable in fragmented southern hilly regions.
The comparison with existing products is where the resolution advantage becomes vivid. Against the 10-kilometer Global Gridded Crop Production Dataset, the new map achieved correlations of 0.89 versus 0.82 in 2019, and a Wilcoxon signed-rank test confirmed its errors were significantly lower, with a p-value below 0.001. The relative root mean square error dropped from 108.88 to 85.55 percent in 2019 and from 93.34 to 85.56 percent in 2020, indicating that the framework suppresses extreme misestimations. In highly fragmented landscapes where maize covers less than 10 percent of a coarse grid cell, the absolute relative production difference between the two products peaked at nearly 80 percent, a measure of how severely mixed pixels distort coarse-grid allocation. Visual comparisons in Changchun, Dezhou, and Kunming showed the coarse product smearing high-production farmland into rivers and villages, and missing small mountain maize plots surrounded by forest, while the 30-meter map captured those scattered patches.
The resulting national maps show production concentrated in dense belts across Heilongjiang, Jilin, and Shandong, each province exceeding 18 million tons annually, with the overall spatial pattern stable between 2019 and 2020 apart from a slight decline in the western Northeast. The authors caution that the absolute accuracy of individual 30-meter pixels remains untested, because field-scale measurements across China are unfeasible to collect; pixel-level evaluation is limited to qualitative spatial comparison. Several uncertainties persist: the maize mask reflects planting rather than harvested area, treats every pixel as fully planted or not planted at all, and its known area overestimation at high latitudes propagates excess production into parts of Heilongjiang. Sparse cloud-free observations in southern provinces may cause underestimation of seasonal NPP, and the uniform radiation use efficiency ignores varietal variation. The top-down allocation also produces discontinuous jumps at provincial boundaries, which the authors deliberately declined to smooth in order to preserve strict statistical consistency.
What makes the work significant beyond agronomy is its replicability. Every input is publicly available, the entire workflow runs on free cloud platforms, and the dataset and processing code have been released through Zenodo. Because the framework allocates statistics rather than learning them, it sidesteps the ground-data bottleneck that constrains machine learning approaches in data-scarce regions, and the authors argue the core architecture can be transferred to other crops with new phenological parameters, crop masks, and validation data. For a country whose food security depends on understanding production variability hidden inside fragmented landscapes, a field-level map that still adds up to the official ledger is a quietly powerful tool, and the researchers suggest that future integration of real-time meteorological data could extend the approach toward within-season forecasting.
Subject of Research: High-resolution spatial downscaling of maize production mapping in China using Google Earth Engine and satellite-derived net primary production
Article Title: A GEE-based spatial downscaling model for high-resolution (30m) maize production mapping in China
Article References: Jiao, S., Ai, Z., Zhao, G., Zhao, X., Song, S., Yu, L., Ma, Q., Yang, Z., Mahmood, R., Manevski, K., & Li, F. (2026). A GEE-based spatial downscaling model for high-resolution (30m) maize production mapping in China. Smart Agricultural Technology, 15, Article 102662. https://doi.org/10.1016/j.atech.2026.102662
Image Credits: AI Generated
DOI: 10.1016/j.atech.2026.102662
Keywords: maize production, spatial downscaling, Google Earth Engine, Sentinel-2, remote sensing, net primary production, China, food security, crop mapping, 30-meter resolution, CMP30m, agricultural monitoring
News Source: Alan Morgan. (October 26, 2026). New 30-Meter Maps Reveal China’s Maize Production Field by Field. Scienmag.