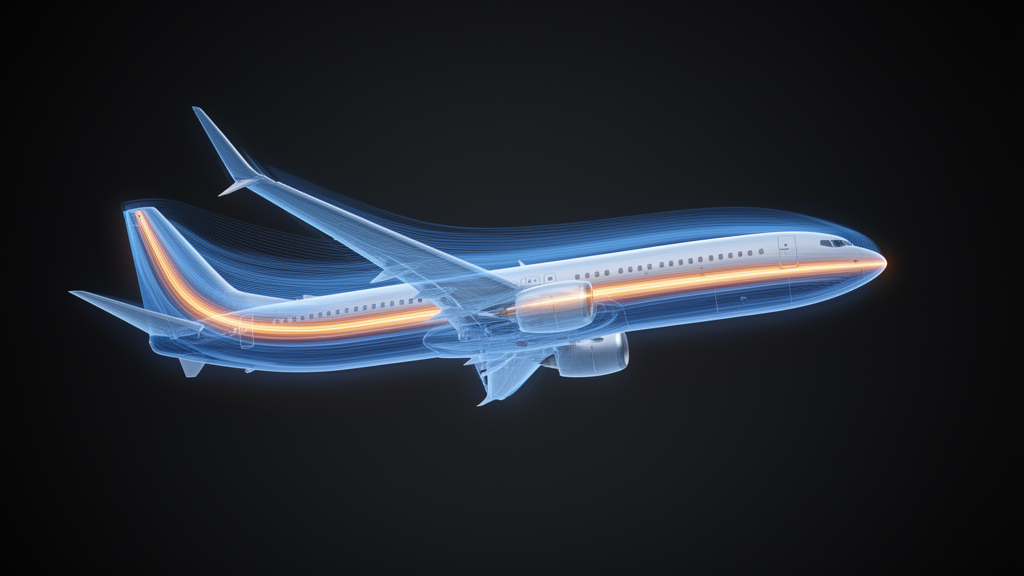
A team of aerospace researchers has pieced together one of the most closely guarded shapes in commercial aviation: the wing of the Boeing 737 MAX 8. Because the airfoil profiles, thickness-to-chord ratios, and incidence angles of the real aircraft are proprietary, Md Mashiur Rahman, Muhammad K. Akbar, Achintya Kumar Saha, Bruce Jo, and Rory Roberts built six simplified computer-aided design configurations with different plausible combinations of these parameters, then ran them through high-fidelity computational fluid dynamics simulations in ANSYS Fluent. Their open-access study, published in Aerospace Systems, identified one configuration, Model E, as the most representative baseline for the aircraft in cruise condition, and used it to map how lift, drag, and aerodynamic efficiency behave at a cruising altitude of 35,500 feet and a Mach number of 0.7708.
The motivation reaches beyond one aircraft. By some estimates cited in the study, aircraft account for 9 percent of US transportation energy usage, and the number of aircraft operations has been rising steadily. As the industry pursues carbon-neutral fuels, introducing alternative fuels can prompt changes in the engine, propulsion system, and combustion process, and ultimately in the aircraft’s architecture itself. With all those reconfigurations, evaluating aerodynamic characteristics becomes necessary, and the goal almost always comes back to improving the lift-to-drag ratio. Yet the detailed aerodynamic properties of most commercial aircraft are proprietary and not freely available in the open literature, which is precisely why the authors set out to establish a benchmark for the 737 MAX 8 that future studies can use as a reference point for modifying and optimizing the design to generate high lift.
The physics the team confronted is a classic tug-of-war between two drag families. Induced drag is a byproduct of the lift generated by the wing, so it is unavoidable, even encouraged. Parasite drag, which does not aid the airplane in flight, may account for as much as 80 to 95 percent of total drag at cruise speed, manifesting as form drag from the aircraft’s shape, interference drag where airstreams collide and create eddy currents, and skin friction from the boundary layer that forms along every surface. Parasite drag increases as the square of air speed, while induced drag varies inversely with the square of air speed, producing a minimum total drag point. The pilot primarily controls lift and drag by changing the wing’s angle of attack, and the aircraft’s shape, sweep angle, flaps, and slats all contribute as well.
Before touching the 737 MAX 8, the researchers validated their entire methodology against the ONERA M6 wing, a widely used NASA transonic benchmark with published experimental pressure data. They generated a refined unstructured poly-hexahedral mesh of 8,944,278 cells, applied a symmetry boundary on one side of the air domain and far-field conditions on the rest, and measured pressure coefficients at seven spanwise locations for direct comparison with NASA Langley results. Although the original benchmark study used the NASA-SST model, the team employed both the Spalart-Allmaras one-equation turbulence model and the k-omega SST model for comparison. The lift and drag coefficients obtained with both models closely matched NASA CFD results, and the pressure-coefficient plots agreed well with experimental data and published numerical results, giving the authors confidence in the mesh quality and model setup for the aircraft analysis that followed.
For the full aircraft, the team solved the three-dimensional compressible Reynolds-Averaged Navier-Stokes equations with the Spalart-Allmaras turbulence model, using a density-based solver with air modeled as an ideal gas and the energy equation enabled for compressible flow. The computational domain measured 55 by 110 by 280 meters, large enough that doubling it showed no significant changes. The boundary-layer mesh consisted of eight prism layers with a first-layer thickness of 5 times 10 to the minus 5 meters, and the final mesh contained approximately 6,954,564 cells. A three-grid Grid Convergence Index analysis, using the lift-to-drag ratio as the representative parameter, showed fine, medium, and coarse meshes producing values of 16.19, 16.22, and 16.38, with a fine-grid GCI of just 0.073 percent and an asymptotic-range indicator of approximately 0.998. Because the study required many simulations across configurations, angles of attack, and Mach numbers, the coarse mesh was selected as a practical balance between accuracy and computational cost.
With six configurations simulated, Model E emerged as the standout. Its drag polar showed the closest overall agreement in trend with reference drag-polar data reported in the literature, and at an angle of attack of 2 degrees its predicted lift coefficient came close to available pilot-derived data, although the predicted drag coefficient was lower. That difference is expected, the authors explain, because the pilot-derived data represent an operating aircraft with an air-breathing turbofan propulsion system, while the CFD study considers only the external aerodynamics of a simplified geometry. The nacelles were modeled as hollow external surfaces without fan blades, spinner, internal flow paths, or exhaust, and drag-producing features such as detailed wing-body fairings, landing-gear openings, and surface protuberances were omitted to facilitate mesh generation. The pilot-derived data therefore serve as an aircraft-level reference rather than a direct one-to-one validation.
The aerodynamic coefficients of Model E followed textbook trends with a transonic twist. The lift coefficient increased approximately linearly from 0.34 at 0 degrees to 0.79 at 4 degrees, while the drag coefficient rose nonlinearly from about 0.026 to 0.062 over the same range, partly because lift-induced drag increases roughly with the square of the lift coefficient for a finite wing, and partly because shock waves were observed over the wing at every angle of attack investigated. Aerodynamic efficiency climbed from approximately 12.8 at 0 degrees to 15.8 at 1 degree, reaching a maximum lift-to-drag ratio of 16.33 at 2 degrees, then fell to about 14.8 at 3 degrees and 12.7 at 4 degrees as drag outpaced lift. The maximum efficiency occurring near 2 degrees angle of attack is the kind of cruise-relevant number that aircraft-level optimization studies need.
The transonic analysis delivered the study’s most striking numbers. Sweeping the freestream Mach number from 0.5708 to 0.9708, the team placed the critical Mach number, at which the maximum local flow first reaches sonic speed, at approximately 0.6108. Beyond that threshold, the supersonic pocket over the upper surface expanded and the terminating shock migrated downstream, from a nondimensional chordwise location of 0.033 at Mach 0.6108 to 0.102, 0.220, and 0.427 at Mach 0.6708, 0.7208, and 0.7708, reaching 0.905 at Mach 0.9708. No distinct lower-surface shock appeared until approximately Mach 0.8708. Drag remained low and changed gradually at lower Mach numbers, but its rate of increase became substantially greater beyond the drag-divergence Mach number, approximated at about 0.72. The lift coefficient rose moderately with Mach number, reaching roughly 0.60 in the 0.72 to 0.77 range, before decreasing rapidly at higher Mach numbers as shock-induced pressure redistribution and flow separation took hold.
At the cruise condition, the simulations resolved the intimate coupling between the shock and the boundary layer. The upper wing carried a broad low-pressure region, with surface temperatures ranging from about 228 to 251 kelvin against a freestream of 218 kelvin. The rapid pressure recovery across the upper-surface shock imposed a strong adverse pressure gradient, and a localized region of reversed streamwise velocity near the trailing edge, together with a substantial reduction in the skin-friction coefficient, provided evidence of shock-induced boundary-layer separation. The pressure-coefficient distributions at spanwise stations from 0.20 to 0.90 revealed substantial three-dimensional variation: the upper-surface shock sat at roughly 0.77 of chord inboard and shifted progressively toward the leading edge to about 0.43 near the outboard wing, while upper-surface suction strengthened outboard, with the minimum pressure coefficient approaching minus 1.3. Such spanwise variations are characteristic of transonic flow over swept wings, consistent with behavior reported for the NASA Common Research Model.
The wake told its own story. Because pressure beneath the wing exceeds pressure above it, flow curls around the wingtip from the high-pressure lower surface toward the low-pressure upper surface, forming a wingtip vortex that induces downwash and contributes to induced drag. The contours showed a concentrated region of high vorticity, plotted on a common range of 0 to 150 per second, that remained identifiable at a plane 36 meters downstream of the wing, while vertical-velocity contours spanning minus 125 to plus 125 meters per second illustrated the rotating vortex’s vertical motion, with negative values indicating downwash. Wingtip vortices are primary contributors to wake turbulence and reduced aerodynamic performance, and previous studies have reported that winglets can reduce their adverse effects. Overall, despite the geometric simplifications and the uncertainties inherent in approximating proprietary aircraft geometry, trim, and operating condition, the study establishes a numerically validated and aerodynamically representative 737 MAX 8 baseline whose physically consistent prediction of critical Mach number, drag divergence, shock development, spanwise pressure variation, and wake structures can serve as a reference for aerodynamic assessment and optimization of advanced, high-efficiency aircraft configurations.
Subject of Research: Aerodynamic study of Boeing 737 MAX 8 in cruise condition using computational fluid dynamics techniques
Article Title: Aerodynamic study of Boeing 737 MAX 8 in cruise condition using computational fluid dynamics techniques
Article References: Rahman, M. M., Akbar, M. K., Saha, A. K., Jo, B., & Roberts, R. (2026). Aerodynamic study of Boeing 737 MAX 8 in cruise condition using computational fluid dynamics techniques. Aerospace Systems. https://doi.org/10.1007/s42401-026-00559-x
Image Credits: AI Generated
DOI: 10.1007/s42401-026-00559-x
Keywords: Boeing 737 MAX 8, computational fluid dynamics, transonic flow, aerodynamics, critical Mach number, drag divergence, shock-boundary-layer interaction, wingtip vortices, Spalart-Allmaras, Aerospace Systems, Aerodynamic, Boeing
News Source: Audrey Campbell. (October 26, 2026). Simulated 737 MAX 8 reveals transonic shocks and peak cruise efficiency. Scienmag.