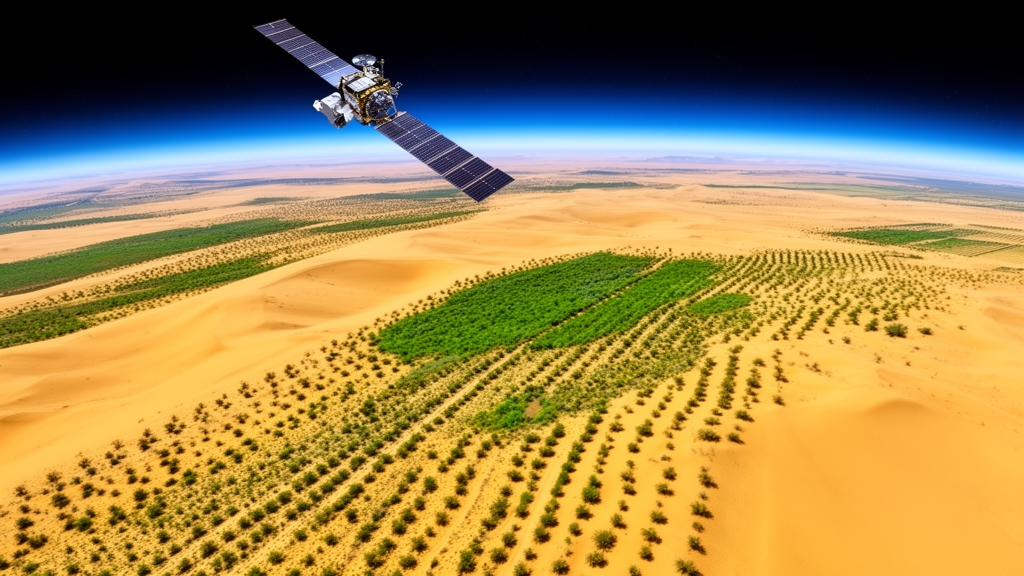
More than 80 percent of China’s Kubuqi Desert has shown a highly significant increase in vegetation greenness over the past 24 years, according to a new analysis of satellite data spanning 2000 to 2023. The study, published in Frontiers in Ecology and Evolution, combined vegetation index measurements, climate records, and land use maps to untangle how climate shifts and human restoration programs have reshaped one of northern China’s most important ecological barriers. Using the Normalized Difference Vegetation Index, or NDVI, a satellite-derived measure of plant vigor calculated from the contrast between near-infrared and red light reflected by vegetation, researchers found that 95.43 percent of the desert’s area experienced rising NDVI during the growing season. Only 2.98 percent of the territory showed a declining trend. The overall growing-season NDVI climbed at an annual rate of 0.0041, and the upward trajectory became statistically very pronounced after 2011, pointing to a long, gradual process of recovery rather than a sudden turning point.
The Kubuqi Desert occupies the northern margin of the Ordos Plateau in Inner Mongolia, covering roughly 16,100 square kilometers and stretching about 400 kilometers from east to west, with a width of just 15 to 20 kilometers. It forms a transitional belt between China’s arid and semi-arid zones and experiences a continental semi-arid monsoon climate, with average annual rainfall of 275 millimeters that diminishes from east to west, mean annual temperatures between 6 and 7.5 degrees Celsius, and a frost-free season of 122 to 160 days. As a core area of the long-running Three-North Shelter Forest Program, the desert serves as a natural experimental platform for examining how engineered ecological restoration interacts with the regional climate system. The research team, based at Inner Mongolia Agricultural University and the Ordos Forestry and Grassland Bureau, drew on the MOD13Q1 satellite dataset at 250-meter resolution, processed with Savitzky-Golay filtering to remove noise, alongside 30-meter land cover classifications and 1-kilometer monthly climate grids.
Methodologically, the study layered several quantitative techniques. The Theil-Sen estimator combined with the Mann-Kendall test quantified pixel-level NDVI trends while limiting the influence of outliers. A difference method graded each part of the desert into categories ranging from severe degradation to significant improvement, and a centroid migration model tracked the shifting center of gravity of vegetation greenness across the landscape. Partial correlation analysis and multiple linear regression isolated the influence of individual climate variables, while the geodetector method measured how well each factor explained the spatial distribution of NDVI. Finally, an autoregressive integrated moving average, or ARIMA, model projected vegetation conditions five years into the future, a forecasting approach more common in economics than in remote sensing research.
The spatial pattern of recovery is strikingly uneven. NDVI values in the eastern desert generally exceed 0.2, while the western portion sits between 0 and 0.2, producing a clear gradient of lower greenness in the west and higher in the east. Improvement zones cover 63.97 percent of the area, concentrated in the eastern and southern parts, while degraded areas account for just 1.63 percent, with the most prominent vegetation loss along the desert’s northern edge near the Yellow River. The western sector has remained largely stable. Across land use types, cropland recorded the highest NDVI values, ranging from 0.31 to 0.46 with an annual increase of 0.0047, grassland ranged from 0.17 to 0.28 with a yearly rise of 0.0038, and barren land stayed below 0.15 with a minimal annual growth of 0.0012. The NDVI centroid drifted westward over the study period, and its migration path narrowed progressively after 2011, indicating that the spatial configuration of vegetation cover has grown steadier over time.
Yet the long-term outlook is more complicated than the greening record alone suggests. Rescaled range analysis of the NDVI time series yielded an average Hurst exponent of 0.48, just below the 0.5 threshold that separates random behavior from persistent trends. In total, 61.21 percent of the territory shows a Hurst exponent below 0.5, indicating weak anti-persistence, meaning future changes may reverse rather than continue past directions. When the Hurst exponent was combined with observed NDVI trends, the analysis projected that 60.19 percent of the desert leans toward future degradation, including 58.72 percent of areas that improved in the past but are expected to decline ahead. Only 36.71 percent of the region shows persistent improvement, mainly in the western bare land zones. The researchers suggest that areas of past improvement facing future decline, largely in the south and east, may reflect the aging and deterioration of vegetation planted during earlier desert control campaigns, while degradation near the Yellow River and urban centers could stem from human pressures.
The climate record over the same period points toward a warmer and wetter regional environment. Annual total precipitation increased at a rate of 0.98 millimeters per year, the annual mean maximum temperature rose by 0.05 degrees Celsius per year, and the annual mean minimum temperature climbed by 0.02 degrees Celsius per year. Spatially, precipitation gains concentrated in the eastern and southern parts of the desert while the central and northwestern areas saw declines, whereas maximum temperatures rose across the entire study area, with the strongest increases in the central and northwestern regions. This hydrothermal arrangement helps explain the east-west vegetation gradient, since rainfall is concentrated where greenness is highest and heat accumulates where vegetation remains sparse.
Human activity left an equally visible fingerprint on the landscape. In 2000, barren land dominated the Kubuqi Desert, covering 44.94 percent of its area, but by 2023 that share had fallen to 30.70 percent as ecological governance projects advanced. The conversion of barren land to grassland accounted for 15.49 percent of the total area, with most of this transition occurring in the western and central sectors, while 0.70 percent of barren land became cropland. The reverse process also occurred, with 2.15 percent of grassland and 0.03 percent of cropland degrading back to barren land. Meanwhile, 6.09 percent of grassland was converted to cropland, a trend that has intensified in recent years and pushed the cropland share steadily upward, particularly in the eastern zone and along the northern boundary. The study attributes these phased land use shifts to regional initiatives including the Three-North Shelterbelt Program, natural forest conservation, sand source control near Beijing and Tianjin, and grassland ecosystem preservation.
The analysis of climate-vegetation relationships revealed a pronounced temporal lag in how the desert’s plants respond to weather. Across all land use types, NDVI correlated positively with precipitation received before the growing season, with bare land and grassland responding most strongly to rainfall with a delay of two to three months. Grassland and cropland showed significant responses to precipitation during the middle and late growing season with lags of one to three months and two to three months respectively. Temperature effects followed a similar pattern: elevated temperatures correlated positively with NDVI while cooler temperatures showed an adverse connection, and responses to both warm and cold conditions carried delays of roughly one to three months. At the annual scale, partial correlation analysis found that total annual precipitation correlated extremely significantly with the NDVI of barren land, cropland, and grassland, with coefficients of 0.540, 0.545, and 0.584 respectively, while annual mean maximum temperature showed significant positive correlations of 0.465, 0.450, and 0.449. Annual mean minimum temperature had no significant impact on any of the three vegetation types.
Multiple linear regression quantified the relative contributions of each factor. For barren land, cropland, and grassland, total annual precipitation contributed 41.55, 34.36, and 41.67 percent respectively, while annual mean maximum temperature contributed 56.27, 43.97, and 48.15 percent. The lower precipitation contribution for cropland may reflect artificial irrigation in farming practices. The geodetector analysis added spatial nuance: for barren land, annual mean maximum temperature had the strongest explanatory power at q = 0.401, while for grassland, total annual precipitation dominated with q = 0.486, and for cropland, precipitation led with q = 0.211, with temperature effects statistically insignificant, likely because of intensive human management. Interaction analysis showed that any two climate factors combined explained NDVI variation better than either alone, with the pairing of total annual precipitation and annual mean maximum temperature producing the highest interaction values, reaching 0.503 for grassland. This synergy illustrates how water and heat work together in desert ecosystems, since adequate rainfall cools and protects plants during hot periods while sufficient warmth drives the transpiration and photosynthesis that rainfall makes possible.
Looking forward, the ARIMA model, configured as ARIMA(0,1,0) after stationarity adjustment and validated with a white noise test, forecasts continued greening through 2028. Growing-season NDVI for the entire desert is projected to rise steadily from 0.264 in 2024 to 0.281 in 2028, with grassland climbing from 0.280 to 0.296, cropland from 0.460 to 0.483, and barren land inching from 0.124 to 0.128. The authors caution that their attribution of driving mechanisms remains incomplete, since the analysis considered only precipitation and temperature while omitting evapotranspiration, wind speed, and soil moisture, and the focus on the May-to-September growing season makes it difficult to separate long-term trends from interannual climate variability. They also propose targeted management: prioritizing natural herbaceous restoration in the western bare land, restricting cropland expansion and excessive groundwater irrigation in the eastern agro-pastoral zone, and strengthening comprehensive management along the Yellow River’s northern bank to prevent further soil erosion and vegetation loss.
Subject of Research: Spatiotemporal patterns and drivers of vegetation restoration in the Kubuqi Desert from 2000 to 2023
Article Title: Analysis of the spatiotemporal pattern and driving mechanism of ecological restoration in the Kubuqi Desert
Article References: Li, D., Zhao, X., Feng, Y., Liu, S., & Li, X. (2026). Analysis of the spatiotemporal pattern and driving mechanism of ecological restoration in the Kubuqi Desert. Frontiers in Ecology and Evolution, 14, Article 1935371. https://doi.org/10.3389/fevo.2026.1935371
Image Credits: AI Generated
DOI: 10.3389/fevo.2026.1935371
Keywords: Kubuqi Desert, NDVI, ecological restoration, desertification, remote sensing, climate change, land use change, Hurst exponent, geodetector, ARIMA forecasting, Inner Mongolia, Three-North Shelter Forest Program
News Source: Drew Townsend. (October 26, 2026). Satellite Record Reveals Two Decades of Greening in China’s Kubuqi Desert. Scienmag.