Applied mathematics methods used to study mortality rates of multiple waves of COVID-19

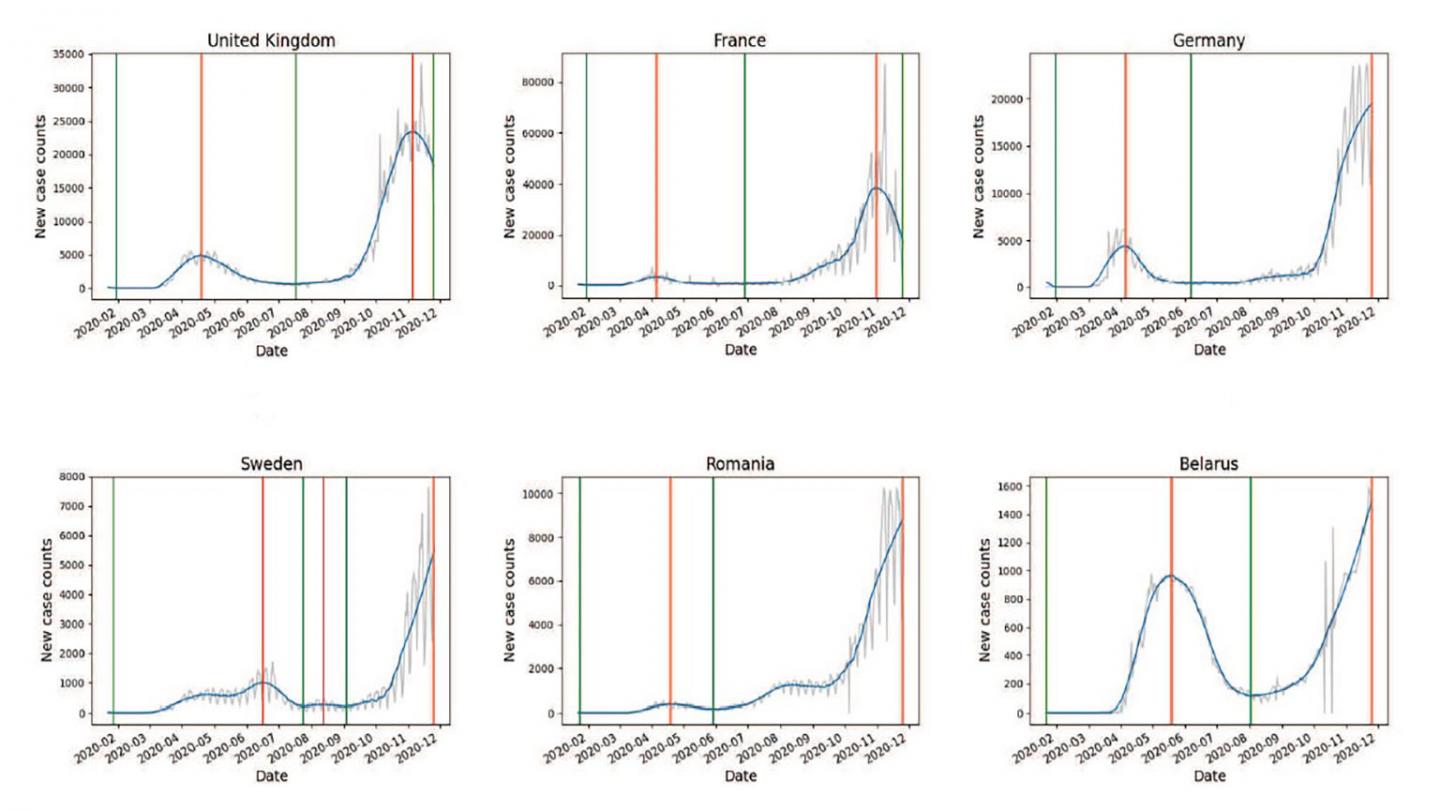
Credit: Nick James, Max Menzies, and Peter Radchenko
WASHINGTON, March 16, 2021 — As Europe experienced its enormous second wave of the COVID-19 disease, researchers noticed the mortality rate — progression from cases to deaths — was much lower than during the first wave.
This inspired researchers from the University of Sydney and Tsinghua University to study and quantify the mortality rate on a country-by-country basis to determine how much the mortality rate from the second wave decreased from the first.
In Chaos, by AIP Publishing, Nick James, Max Menzies, and Peter Radchenko introduce methods to study the progression of COVID-19 cases to deaths during the pandemic’s different waves. Their methods involve applied mathematics, specifically nonlinear dynamics, and time series analysis.
“We take a time series, apply an algorithmic approach to chop it up into first and later waves, and do some relatively simple optimization and calculations to determine two different mortality numbers,” said James, from the University of Sydney.
The mortality rate of the massive European second wave turned out to be much less severe — at least with respect to reported cases and deaths. But how much less severe and how did it differ between countries?
“We think answering these questions is important, and to answer this for all of Europe, not just the wealthier Western countries,” said Menzies, from Tsinghua University. “In Belarus, for example, the mortality rate actually increased during its second wave, while Ukraine and Moldova were still in their first wave as of the end of November.”
The researchers discovered this was very different from the Netherlands, Belgium, France, and other countries that drastically reduced their mortality rates — at least with respect to reported numbers — between their first and second waves.
“Our work shows sharp drops in mortality with respect to reported cases and deaths,” Menzies said. “The problem will always be, what is the true number of cases in the early first wave? We may never know, but we imagine future research and analysis will try to determine it.”
When the researchers reran their analysis on estimated true cases and estimated deaths, Radchenko, from the University of Sydney, pointed out that those measures show serious limitations.
“Excess mortality is often negative relative to previous years, so it’s unsuitable for measuring the true numbers of COVID-19 deaths,” Radchenko said. “We hope others will more closely analyze the true numbers, perhaps using more specialized data such as out of particular hospitals or regions where testing was more reliable.”
Broad similarity was also observed between Europe and the U.S., where Northeastern states behaved similarly to wealthy Western European countries in their sharp reductions of mortality during the second wave.
###
The article “COVID-19 second wave mortality in Europe and the United States” is authored by Nick James, Max Menzies, and Peter Radchenko. It will appear in Chaos on Mar. 16, 2021 (DOI: 10.1063/5.0041569). After that date, it can be accessed at https:/
ABOUT THE JOURNAL
Chaos is devoted to increasing the understanding of nonlinear phenomena in all areas of science and engineering and describing their manifestations in a manner comprehensible to researchers from a broad spectrum of disciplines. See https:/
Media Contact
Larry Frum
[email protected]
Related Journal Article
http://dx.


