• HOME
  • NEWS
  • EXPLORE
    • CAREER
      • Companies
      • Jobs
    • EVENTS
    • iGEM
      • News
      • Team
    • PHOTOS
    • VIDEO
    • WIKI
  • BLOG
  • COMMUNITY
    • FACEBOOK
    • INSTAGRAM
    • TWITTER
Monday, September 29, 2025
BIOENGINEER.ORG
No Result
View All Result
  • Login
  • HOME
  • NEWS
  • EXPLORE
    • CAREER
      • Companies
      • Jobs
        • Lecturer
        • PhD Studentship
        • Postdoc
        • Research Assistant
    • EVENTS
    • iGEM
      • News
      • Team
    • PHOTOS
    • VIDEO
    • WIKI
  • BLOG
  • COMMUNITY
    • FACEBOOK
    • INSTAGRAM
    • TWITTER
No Result
View All Result
Bioengineer.org
No Result
View All Result
Home NEWS Science News Health

NYU professor creates COVID-19 dashboard to compare country and state data

Bioengineer by Bioengineer
January 26, 2021
in Health
Reading Time: 2 mins read
0
IMAGE
Share on FacebookShare on TwitterShare on LinkedinShare on RedditShare on Telegram

Publicly available tool allows users to view data on vaccinations, cases, deaths, testing, and COVID-related policies
IMAGE

Credit: Credit: Alexej Jerschow/NYU

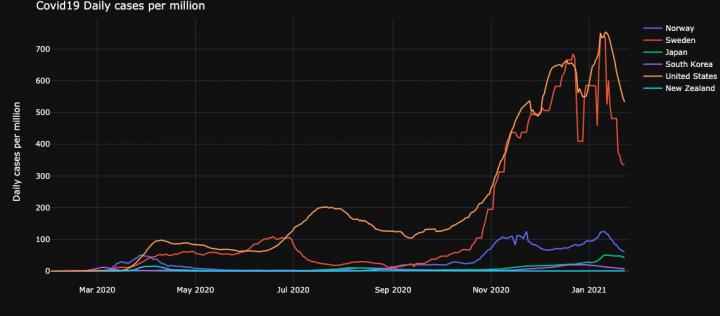
A new online dashboard, created by NYU Professor Alexej Jerschow, brings together COVID-19 data from U.S. states and countries around the world to compare cases, deaths, vaccines, and testing in a visual, user-friendly format.

The tool also integrates a range of policies governments have implemented to limit the spread of COVID-19–including school closings, stay-at-home orders, and mask mandates–in an effort to compare policy responses with COVID-19 outcomes.

Jerschow, who is a professor of chemistry and typically works in the field of magnetic resonance imaging and battery research, was looking for a convenient way to compare COVID-19 data from different countries and states. While the data were available from different sources, there was not a single tool that allowed him to easily analyze how different geographic areas were faring and responding to the pandemic–so, he created one.

“I was curious, for example, whether one could draw parallels between specific U.S. states and other countries, and also how cases correlate with policy decisions,” said Jerschow. “My hope is that this dashboard can fill the gap and become a resource to help people quickly gain an overview of how the COVID situation and policy decisions develop. It is going to be particularly interesting to look at what happens once the vaccinations ramp up further.”

For instance, while the U.S. and Sweden have reported high numbers of COVID-19 cases and fatalities, the dashboard shows lower prevalence in countries like Japan, South Korea, New Zealand, and Norway. “It is clear from looking at the graphs that these countries have found a formula for success and government actions affected outcomes,” said Jerschow.

.

Crises are not only reflected in cases or fatalities; looking at how many positive cases of COVID-19 are found per test can reveal whether countries and states are managing the crisis well logistically. Countries such as Austria and Mexico and states such as Idaho and Alabama recently experienced periods when more than half of their tests came back positive–bringing into question whether sufficient testing is being done more than six months into the pandemic, when testing capacity should have improved.

The dashboard may be useful to researchers, educators, journalists, and the general public seeking to study COVID-19, compare all 50 U.S. states, U.S. territories, and 192 countries, and easily visualize the data.

###

The dashboard combines data from a series of publicly available sources. Country-wide information is downloaded from Our World in Data, which sources its data from the Johns Hopkins Center for Systems Science and Engineering dashboard. U.S. state and territory data are obtained from covidtracking.com. The Oxford COVID-19 Government Response Tracker (OxCGRT) provides policy data.

Media Contact
Rachel Harrison
[email protected]

Original Source

https://www.nyu.edu/about/news-publications/news/2021/january/covid-19-dashboard.html

Tags: Infectious/Emerging DiseasesMedicine/HealthPolicy/EthicsPublic HealthVaccines
Share12Tweet8Share2ShareShareShare2

Related Posts

Cipepofol: Safe, Effective for Elderly Digestive Endoscopy

September 29, 2025

Medicaid Unwinding Leads to Decreased Medication Treatment for Opioid Use Disorder

September 29, 2025

Yale Scientists Pioneer Innovative Diagnostic Test for Leptospirosis

September 29, 2025

Mapping Depression and Internet Use in Chinese Students

September 29, 2025
Please login to join discussion

POPULAR NEWS

  • New Study Reveals the Science Behind Exercise and Weight Loss

    New Study Reveals the Science Behind Exercise and Weight Loss

    87 shares
    Share 35 Tweet 22
  • Physicists Develop Visible Time Crystal for the First Time

    73 shares
    Share 29 Tweet 18
  • How Donor Human Milk Storage Impacts Gut Health in Preemies

    58 shares
    Share 23 Tweet 15
  • Scientists Discover and Synthesize Active Compound in Magic Mushrooms Again

    56 shares
    Share 22 Tweet 14

About

We bring you the latest biotechnology news from best research centers and universities around the world. Check our website.

Follow us

Recent News

Advancing Lithium-Ion Batteries Through Solvation Engineering

Cipepofol: Safe, Effective for Elderly Digestive Endoscopy

Advancing Neonatal Nephrology: Insights from First Symposium

Subscribe to Blog via Email

Enter your email address to subscribe to this blog and receive notifications of new posts by email.

Join 60 other subscribers
  • Contact Us

Bioengineer.org © Copyright 2023 All Rights Reserved.

Welcome Back!

Login to your account below

Forgotten Password?

Retrieve your password

Please enter your username or email address to reset your password.

Log In
No Result
View All Result
  • Homepages
    • Home Page 1
    • Home Page 2
  • News
  • National
  • Business
  • Health
  • Lifestyle
  • Science

Bioengineer.org © Copyright 2023 All Rights Reserved.