Credit: NASA GISS/Gavin Schmidt
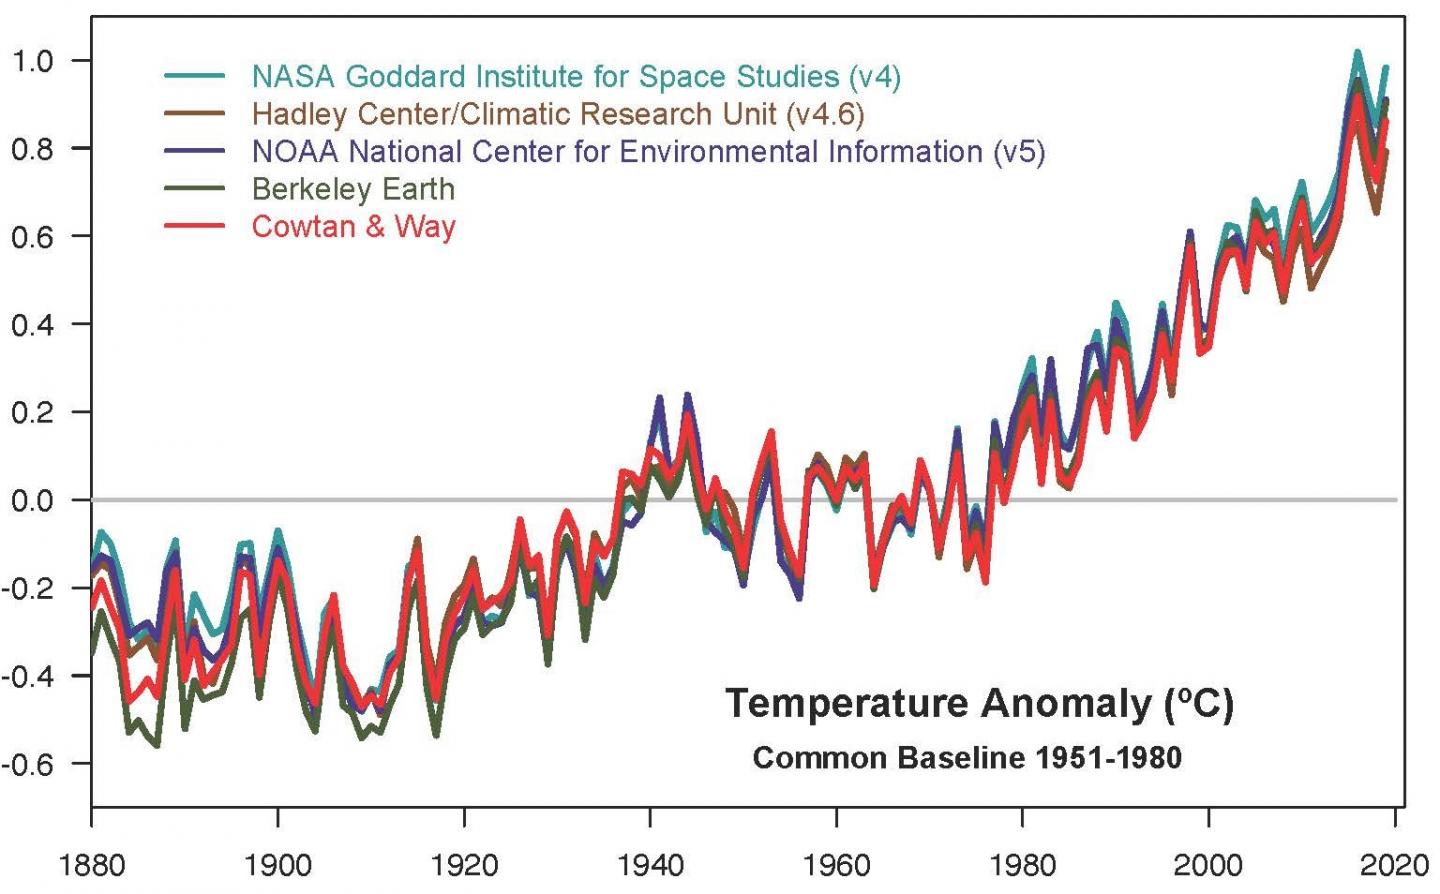
According to independent analyses by NASA and the National Oceanic and Atmospheric Administration (NOAA), Earth’s global surface temperatures in 2019 were the second warmest since modern recordkeeping began in 1880.
Globally, 2019 temperatures were second only to those of 2016 and continued the planet’s long-term warming trend: the past five years have been the warmest of the last 140 years.
This past year, they were 1.8 degrees Fahrenheit (0.98 degrees Celsius) warmer than the 1951 to 1980 mean, according to scientists at NASA’s Goddard Institute for Space Studies (GISS) in New York.
“The decade that just ended is clearly the warmest decade on record,” said GISS Director Gavin Schmidt. “Every decade since the 1960s clearly has been warmer than the one before.”
Since the 1880s, the average global surface temperature has risen and the average temperature is now more than 2 degrees Fahrenheit (a bit more than 1 degree Celsius) above that of the late 19th century. For reference, the last Ice Age was about 10 degrees Fahrenheit colder than pre-industrial temperatures.
Using climate models and statistical analysis of global temperature data, scientists have concluded that this increase mostly has been driven by increased emissions into the atmosphere of carbon dioxide and other greenhouse gases produced by human activities.
“We crossed over into more than 2 degrees Fahrenheit warming territory in 2015 and we are unlikely to go back. This shows that what’s happening is persistent, not a fluke due to some weather phenomenon: we know that the long-term trends are being driven by the increasing levels of greenhouse gases in the atmosphere,” Schmidt said.
Because weather station locations and measurement practices change over time, the interpretation of specific year-to-year global mean temperature differences has some uncertainties. Taking this into account, NASA estimates that 2019’s global mean change is accurate to within 0.1 degrees Fahrenheit, with a 95% certainty level.
Weather dynamics often affect regional temperatures, so not every region on Earth experienced similar amounts of warming. NOAA found the 2019 annual mean temperature for the contiguous 48 United States was the 34th warmest on record, giving it a “warmer than average” classification. The Arctic region has warmed slightly more than three times faster than the rest of the world since 1970.
Rising temperatures in the atmosphere and ocean are contributing to the continued mass loss from Greenland and Antarctica and to increases in some extreme events, such as heat waves, wildfires, intense precipitation.
NASA’s temperature analyses incorporate surface temperature measurements from more than 20,000 weather stations, ship- and buoy-based observations of sea surface temperatures, and temperature measurements from Antarctic research stations.
These in situ measurements are analyzed using an algorithm that considers the varied spacing of temperature stations around the globe and urban heat island effects that could skew the conclusions. These calculations produce the global average temperature deviations from the baseline period of 1951 to 1980.
NOAA scientists used much of the same raw temperature data, but with a different interpolation into the Earth’s polar and other data-poor regions. NOAA’s analysis found 2019 global temperatures were 1.7 degrees Fahrenheit (0.95 degrees Celsius) above the 20th century average.
NASA’s full 2019 surface temperature data set and the complete methodology used for the temperature calculation and its uncertainties are available at:
https:/
GISS is a laboratory within the Earth Sciences Division of NASA’s Goddard Space Flight Center in Greenbelt, Maryland. The laboratory is affiliated with Columbia University’s Earth Institute and School of Engineering and Applied Science in New York.
NASA uses the unique vantage point of space to better understand Earth as an interconnected system. The agency also uses airborne and ground-based measurements, and develops new ways to observe and study Earth with long-term data records and computer analysis tools to better see how our planet is changing. NASA shares this knowledge with the global community and works with institutions in the United States and around the world that contribute to understanding and protecting our home planet.
For more information about NASA’s Earth science activities, visit:
https:/
The slides for the Jan. 15 news conference are available at:
https:/
NOAA’s Global Report is available at:
https:/
###
Media Contact
Peter Jacobs
[email protected]
301-286-0535
Original Source
https:/

