New web application allows anyone to analyze lighting trends observed by satellites since 1992
Credit: GFZ
Many scientific datasets from satellites are in principle available for free, but that doesn’t mean that they are actually accessible to the wider public. A new web application aims to change that, at least for satellite imagery of Earth at night. The app called “Radiance Light Trends” allows anyone with an Internet connection to quickly select a region or a site and analyse the trends in light emissions observed by satellites since 1992. The development of the webapp was guided by Christopher Kyba from the GFZ German Research Centre for Geosciences in Potsdam. It was produced as part of the GEOEssential project funded by the EU’s Horizon 2020 programme, with the coding done by Jurij Stare of Deneb Geoinformation Solutions.
Satellites produce a great deal of data, so simply downloading the data can pose a challenge. “Before this app was developed, if someone new wanted to analyse trends in light emissions for a specific region, I expect it would take them at least a full day to do it”, says Christopher Kyba. “In addition to downloading the data, specialist knowledge of geographic information system software would be needed to select a region and analyse it”. With the “Radiance Light Trends” app, it is now possible for someone with no special training to produce a chart showing light trends in under a minute.
“Users can have the development of light pollution calculated for nearly any site or region in the world”, Christopher Kyba explains. “For example, take an area around Berlin, start the analysis and you will see how much brighter it has become in recent years. What’s special: New satellite data is automatically entered into the database and taken into account for the calculation. This is particularly useful for interested citizens, environmentalists, or journalists, but also for municipal administrations and companies planning lighting measures. The app might be useful for the analysis of natural hazards and the planning or the rebuilding of infrastructure, too.”
Greenhouse lights up, airport dims lighting
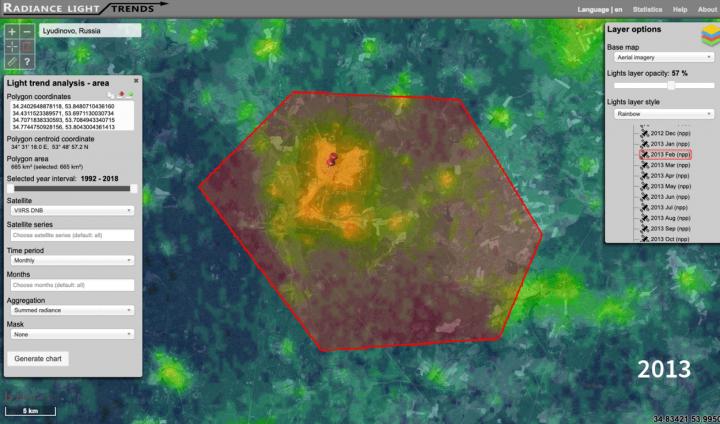
Changes in lighting which can be tracked by “Radiance Light Trends” have a variety of causes, according to Christopher Kyba. One example he points to is Tucson International Airport in Arizona, where hundreds of outdoor lights were replaced in August to October of 2014, in order to reduce energy consumption and light pollution. A clear drop is visible for that location in “Radiance Light Trends” (See the link below for screenshots). Another example is light leakage from large greenhouses, which often introduces new light to areas that used to be quite dark. For instance, a large greenhouse about 350 kilometres south west of Moscow lights up the night with escaping light since 2015 (See the links below for two animated GIFs).
The data underlying the app comes from two satellite instruments run by various government agencies in the USA over the last several decades. For 1992 to 2013, data comes from the Operational Linescan System of the Defense Meteorological Satellite Program (DMSP) satellites. From 2012 the source of data is the Day/Night Band of the Visible Infrared Imaging Radiometer Suite instrument (VIIRS DNB). There are several options to choose from for displaying the satellite data in “Radiance Light Trends”: You can have a colour-coded projection onto a map of the Earth with annual or monthly data, or draw a shape (or polygon) around an area of interest to see a timeline of light data over several years on a monthly basis, for example. The data can also easily be exported in different data formats.
Christopher Kyba suggests that other satellite datasets could be made similarly accessible: “There’s no reason that a similar application couldn’t be produced for measurements of temperatures, or arctic sea ice, or any host of other environmental variables. With that in mind, we are planning on soon releasing the code underlying the webapp under a license that will allow others to reuse it.”
###
Note: Analysing large areas can take several seconds, and during this time the app may respond slowly for other users. For this reason, analyses are currently limited to 5,000 square kilometers. Further details about the satellites, the limitations of satellite data, and the developers and funding of the app can be found in the “About” section of the website.
Further information:
– „Radiance Light Trends” website: lighttrends.lightpollutionmap.info
– GEOEssential project http://www.
Images:
Greenhouse:
Caption: Time series of screenshots showing the light emissions from a large greenhouse complex near Lyudinovo, Russia, 350 kilometres south west of Moscow. (Credit: GFZ)
Detailed image (GIF; open in browser to run animation): http://media.
Cropped image (GIF; open in browser to run animation): http://media.
Video on LED light technology for the greenhouse near Lyudinovo, Russia: https:/
Satellite image of the greenhouse near Lyudinovo, Russia on Google maps: https://www.google.com/maps/place/Agroinvest/@53.8053984,34.5229713,2062m/data=!3m1!1e3!4m13!1m7!3m6!1s0x46cd2562f206bd25:0x4a602b7900bb2f32!2sLjudinowo,+Oblast+Kaluga,+Russland!3b1!8m2!3d53.8638922!4d34.4574753!3m4!1s0x46cd31fe078e217d:0x98958f53c4f07fa8!8m2!3d53.811529!4d34.5211136
Tucson International Airport:
Image 1: http://media.
Caption: Satellite image with projection of light data overlayed of Tuscon International Airport, where hundreds of outdoor lights were replaced in August to October of 2014. (Credit: GFZ)
Image 2: http://media.
Caption: Time series of light data for Tuscon International Airport, where about 650 outdoor lights were replaced during August to October of 2014. (Credit: GFZ)
Media Contact
Philipp Hummel
[email protected]
