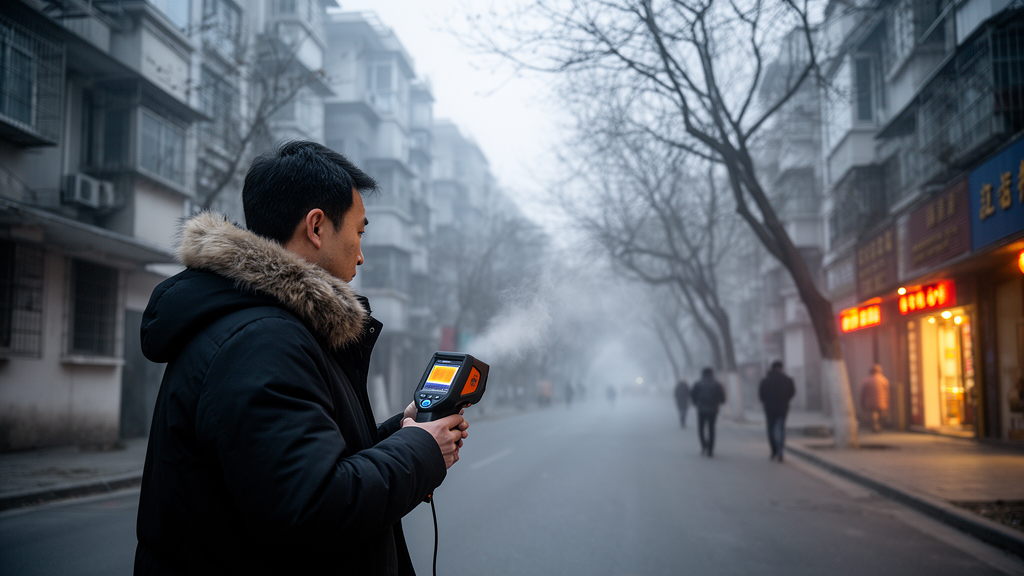
Residents of Hangzhou feel neither cold nor warm outdoors, on average, when the Universal Thermal Climate Index reaches 19.2 degrees Celsius, according to a winter field study that combined meteorological measurements with questionnaire surveys across six types of residential neighborhoods. The neutral range, defined by thermal sensation votes between slightly cool and slightly warm, spanned 17.1 to 21.2 degrees Celsius. The study, published in the journal City and Built Environment, also showed that this benchmark differs measurably depending on the urban morphology of the neighborhood, and that an assessment model tailored to neighborhood type predicts residents’ thermal sensation more accurately than a single citywide equation.
Hangzhou lies in what Chinese climatologists call the hot summer cold winter zone, a subtropical monsoon region where summers are humid and hot while winters are cold and dry. In February, the coldest month, the average maximum temperature is about 8.3 degrees Celsius. Although cold exposure is known to contribute to winter morbidity and mortality in dense urban areas, the authors note that winter outdoor thermal comfort has received far less research attention than heat.
To capture the effect of neighborhood form, the researchers used the Local Climate Zone classification system proposed by Stewart and Oke in 2012, which divides urban landscapes into standardized categories based on building height, spacing, ground surface properties and sky visibility. Using a cloud-free 2024 Landsat-8 image processed on the Google Earth Engine platform with 835 training samples and a random-forest algorithm, they mapped local climate zones across central Hangzhou. The overall classification accuracy was 83.1 percent, rising to 98 percent for the built types. Residential areas, identified through points-of-interest data and building footprints, fell into six built categories: compact mid-rise, compact low-rise, open high-rise, open mid-rise, open low-rise and sparsely built low-rise.
One representative residential community was selected for each zone type, chosen for average land area, similar building age, abundant public activity space and a stable long-term population. Field campaigns ran on non-rainy days from December 2024 to February 2025, with each neighborhood monitored continuously over three days between 09:00 and 17:00. Thirteen measurement points across the six sites recorded air temperature, relative humidity, wind speed and globe temperature at 1.5 meters above ground, using instruments whose resolution and accuracy conform to ASHRAE Standard 55 and ISO 7726. Each site deliberately included both open, unshaded locations and points shaded by buildings or tree canopies, to avoid biasing the zone comparisons toward a single exposure condition.
While the instruments logged data, the team distributed questionnaires to residents near each measurement point at ten-minute intervals, matching each subjective response to the nearest observation period. The survey recorded thermal sensation on the ASHRAE seven-point scale from minus three, cold, to plus three, hot, along with thermal comfort, humidity, wind and sunlight sensations, thermal preference and acceptability. In total, 1,287 valid questionnaires were collected, distributed fairly evenly across the six zone types, with 51.1 percent of respondents male and 48.9 percent female. Age groups ranged from children and teenagers at 4.4 percent to adults aged sixty and over at 22.0 percent, and most respondents had been sitting, standing or walking slowly in the fifteen minutes before interview.
The measurements revealed clear microclimatic contrasts among the neighborhood types. Observed air temperature ranged from 2.2 to 17.9 degrees Celsius across the survey period, with the highest mean of 12.2 degrees Celsius in the sparsely built low-rise zone and the lowest, 7.7 degrees Celsius, in the compact low-rise zone. Globe temperature, which reflects radiant heat, ranged from 2.3 to 30.2 degrees Celsius. Wind speeds were generally low, with a maximum of 2.3 meters per second recorded in the open high-rise zone. The discussion section reports that the maximum difference in mean Universal Thermal Climate Index between zone types reached 4.1 degrees Celsius, a substantial gap attributable to differences in shading, radiation exposure and ventilation created by building density, height and vegetation.
Subjective responses mirrored these physical differences. Overall, about 88 percent of respondents reported neutral-to-cold sensations, with slightly cool the largest single category at 38 percent and cold at 29 percent. But the distribution varied sharply by zone: cold votes reached 46 percent in the compact low-rise zone yet only 8 percent in the open mid-rise zone, where warm votes were most common at 21 percent. The compact low-rise zone also had the highest proportion of uncomfortable votes at 72 percent, while the open high-rise zone had the highest share of comfortable votes at 55 percent. Fitting thermal sensation against the thermal comfort index for each zone separately produced strong linear relationships, with coefficients of determination between 0.73 and 0.88, and revealed systematic differences in thermal sensitivity. Residents of the sparsely built low-rise zone were the most sensitive, with thermal sensation rising 0.320 units per degree of index increase, while those in the compact low-rise zone were the least sensitive at 0.218 units per degree.
Neutral temperatures also differed by zone, ranging from 18.6 degrees Celsius in the open mid-rise zone to 21.7 degrees Celsius in the compact low-rise zone. The authors argue this heterogeneity means that comfort benchmarks derived from a single neighborhood type cannot adequately represent others, a limitation of many earlier field studies that pooled sites or generalized from one or two locations. Their solution was a weighted model: the six zone-specific regression equations were combined according to each zone’s share of residential land in central Hangzhou, which ranged from 59.8 percent for open mid-rise down to 0.2 percent for sparsely built low-rise. The resulting equation, thermal sensation equals 0.249 times the index minus 4.768, was validated on 30 percent of the dataset held back from fitting.
The validation showed the weighted model outperformed every single-zone equation, achieving an adjusted coefficient of determination of 0.914 and an accuracy improvement of 8.8 to 49.8 percent over the alternatives. Applying the model, the team calculated the winter neutral index for Hangzhou’s residential neighborhoods at 19.2 degrees Celsius with a neutral range of 17.1 to 21.2 degrees Celsius. They also examined thermal acceptability directly: within the observed winter index range of 3.8 to 26.7 degrees Celsius, more than 80 percent of residents found conditions acceptable once the index exceeded 8.1 degrees Celsius, and more than 90 percent once it exceeded 11.2 degrees Celsius. The acceptability range proved considerably broader than the neutral range, which the authors interpret as evidence of residents’ strong adaptation and tolerance, likely shaped by clothing choices, activity patterns and thermal history.
Comparisons with other studies in the hot summer cold winter zone highlighted how both climate and context shape these benchmarks. Haining, also in Zhejiang Province, showed a neutral index 3.4 degrees Celsius lower than Hangzhou’s, which the authors attribute to its colder winters, its factory-area study sites and a respondent pool limited to factory workers. Chengdu studies in urban parks reported slightly lower neutral values with wider ranges, consistent with more open settings. The Wuhan results, gathered in residential neighborhoods across all four seasons, came closest to the Hangzhou figures. The authors caution that their findings represent winter conditions in Hangzhou residential areas only, and that multi-seasonal data and non-residential zone types such as parks and office districts will be needed to generalize the framework. Within those limits, they propose the approach as a transferable method: by linking measurable morphological units to residents’ actual perception, planners can identify priority areas, compare the expected effect of shading, greening or ventilation interventions, and assess outdoor thermal comfort at the scale of the whole city rather than a single exemplar site.
Subject of Research: Winter outdoor thermal comfort and its variation across residential local climate zone types in Hangzhou, China
Article Title: Optimizing an outdoor thermal comfort assessment model for residential neighborhoods based on the local climate zone classification: a winter field study in Hangzhou
Article References: Wu, J., Zhao, H., Gao, Y., Yao, B., & Zheng, Z. (2026). Optimizing an outdoor thermal comfort assessment model for residential neighborhoods based on the local climate zone classification: a winter field study in Hangzhou. City and Built Environment, 4(1), Article 6. https://doi.org/10.1007/s44213-026-00070-1
Image Credits: AI Generated
DOI: 10.1007/s44213-026-00070-1
Keywords: outdoor thermal comfort, Universal Thermal Climate Index, Local Climate Zone, Hangzhou, urban microclimate, winter thermal perception, residential neighborhoods, questionnaire survey, field measurement, urban planning, thermal sensitivity, neutral temperature
News Source: Denise Maddox. (October 30, 2026). Winter Field Study Maps Thermal Comfort Across Hangzhou’s Residential Neighborhood Types. Scienmag.