Contributing to the understanding of global warming impacts
Credit: NIES
Socio-economic activities in the present world have become increasingly interdependent because of rapid technological progress, urbanization, and globalization. Because of these interdependencies between human society and natural ecosystems, climate impacts on one sector may influence other sectors, including seemingly remote ones, which we call “interconnections of climate risks”. While a substantial number of climate risks are identified in the Intergovernmental Panel on Climate Change (IPCC) Fifth Assessment Report (AR5), there have been few attempts to explore the interconnections between them in a comprehensive way.
In our study, we developed a method of effectively visualizing climate risks and their cause-effect relationships (both negative and positive impacts) based on a literature survey. We reviewed existing literature to extract climate risk items, as well as climatic drivers, i.e., physical changes in the global climate system caused by the emissions of climate forcers, such as an increase in air temperature or a decrease in precipitation. Overall, we identified a total of 87 risk factors that can be associated with seven sectors (water; food; energy; industry & infrastructure; disaster & security; health; and ecosystems), which are also consistent with the chapters in IPCC Working Group II AR5, and 17 climatic drivers. In all, 253 causal relationships were identified. Following the literature survey, we developed a practical methodology for visualizing chains of climate risks. To deal with the complexity of the overall network map, we divided the causal connections of climate risks based on the 7 sectors and generated network diagrams of risk interconnections. The figures were refined by our graphic designer to make the interconnections more easily traceable.
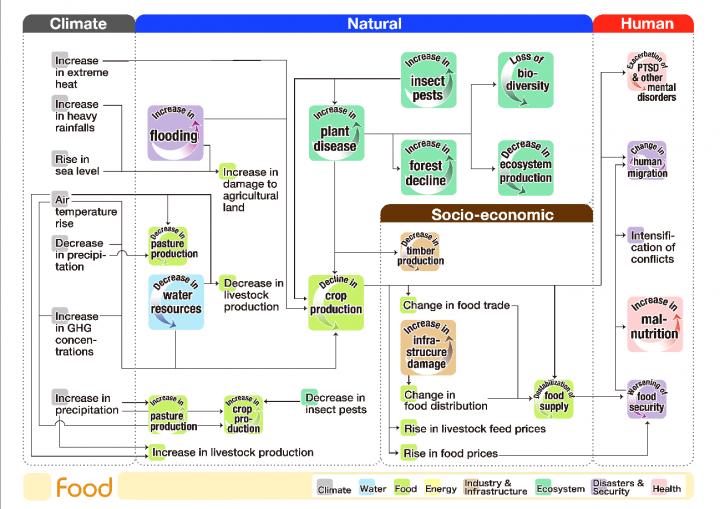
Figure 1 shows the network map for the food sector.
Changes in the climate system impact natural and socio-economic systems, ultimately influencing human security and health. Based on this understanding of the overall structure of climate risk transmissions, we prepared a “network flowchart” by re-allocating the nodes and icons according to the natural, socio-economic and human systems (Figure 2). By assigning the climate system to the upstream (far left) position and the human system to the downstream or endpoint (far right) position in this flowchart, with the natural and socio-economic systems in between, the direction of the arrows is essentially from left to right, which enables us to readily grasp the structure of the climate risk cascades.
The climate drivers shown at the far left of the figure (gray bar) are direct causes of the decline in crop production, which is also caused by changes in natural system (blue bar) such as decrease in water resources. A decline in crop production affects, in turn, elements of the socio-economic system (brown bar) such as food trade, price, and distribution, leading to issues in the human system (red bar) such as conflict, migration, and malnutrition. Hence ‘decline in crop production’ is placed in the center of the figure.
In sum, our visualization showed that climate risks are interconnected across a wide variety of sectors, and a particular risk is caused by multiple direct and indirect pathways. Our study also showed how changes in temperature and precipitation affect the natural and socio-economic systems, ultimately influencing human security, health, and well-being. Simplifying the ways in which climate risk information is delivered is a necessary step in enhancing the public’s understanding of the relationship between apparently distant climate impacts and their everyday lives. Stakeholders may use the visualizations as a guide to prepare for possible future impacts related to their particular field of activity. Our climate risk network diagrams may serve as a useful tool to foster a greater public understanding of what climate change can mean to society.
###
Funding resources:
This research was carried out as part of the Integrated Research Program for Advancing Climate Models supported by the Ministry of Education, Culture, Sports, Science and Technology, Japan, and the Environment Research and Technology Development Fund (S-14) of the Environmental Restoration and Conservation Agency, Japan.
Article: Yokohata, T., K. Tanaka, K. Nishina, K. Takahashi, S. Emori, M. Kiguchi, Y. Iseri, Y. Honda, M. Okada, Y. Masaki, A. Yamamoto, M. Shigemitsu, M. Yoshimori, T. Sueyoshi, K. Iwase, N. Hanasaki, A. Ito, G. Sakurai, T. Iizumi, M. Nishimori, W. H. Lim, C. Miyazaki, A. Okamoto, S. Kanae, T. Oki: Visualizing the interconnections among climate risks. Earth’s Future, 7, https:/
URL: https:/
Contact:
Dr. Tokuta Yokohata
Climate Risk Assessment Section
Center for Global Environmental Research
National Institute for Environmental Studies
Tel: 029-850-2783
Email: [email protected]
Media Contact
Tokuta Yokohata
[email protected]
Original Source
https:/
Related Journal Article
http://dx.


