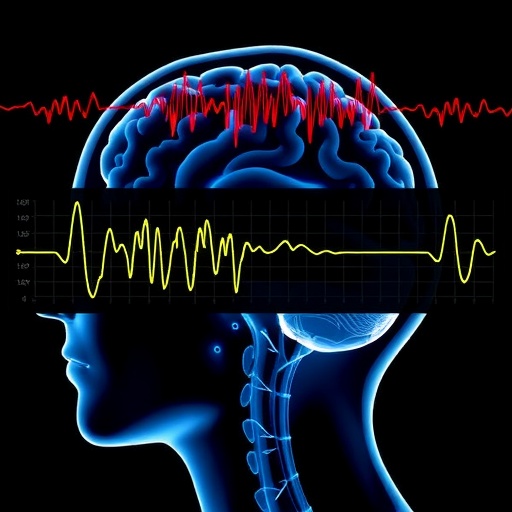
For decades, neurointensivists have peered at the jagged pulse traces scrolling across bedside monitors, trying to read in the shape of an intracranial pressure waveform a hidden message about how much room the injured brain has left. A new study from the Brain Physics Laboratory at the University of Cambridge, published in Neurocritical Care, now provides that long-standing visual practice with something it has never had before: rigorous quantitative validation. The research also delivers a cautionary note, showing that waveform shape alone, however elegantly quantified, cannot tell the whole story of intracranial physiology.
Intracranial compliance describes the capacity of the rigid, adult skull to absorb changes in volume. According to the Monro–Kellie doctrine, the intracranial compartment is effectively fixed in size, so any expansion of brain tissue, blood or cerebrospinal fluid must be offset by a reduction in one of the others. When that compensatory reserve runs out, even small increments in volume produce steep, dangerous rises in intracranial pressure (ICP), a major driver of secondary brain injury after trauma. Clinicians can measure compliance directly only through invasive infusion tests, which are intermittent and impractical for continuous use. In practice, they have instead relied on the pulsatile ICP waveform, which classically consists of three peaks: the percussion wave (P1), driven by arterial inflow; the tidal wave (P2), linked to intracranial compliance; and the dicrotic wave (P3), associated with aortic valve closure and venous outflow. As compliance deteriorates, P2 grows relative to P1, and the P2/P1 ratio has long served as an experimentally validated, though rarely quantified, surrogate of unscaled intracranial compliance.
Led by Ihsane Olakorede, with Stefan Yu Bögli, Marek Czosnyka and Peter Smielewski, the Cambridge team set out to determine whether the pulse shape index (PSI), a recently formalised, automated version of bedside visual waveform assessment, faithfully reproduces the compliance information contained in the P2/P1 ratio. PSI uses a pre-trained deep learning model, built on a ResNet architecture, to assign each individual ICP pulse to one of four morphological categories, ranging from normal (1) to pathological (4). The index reported over any given time window is the weighted mean of those class values, so a rising PSI signals a growing prevalence of pathological waveform features.
The evidence base was substantial. The team analysed 4,388 non-overlapping five-minute segments drawn from 96 high-resolution recordings of simultaneous ICP and transcranial Doppler (TCD) blood velocity, collected from 38 patients with traumatic brain injury admitted to Addenbrooke’s Hospital’s Neurosciences Critical Care Unit in Cambridge between 2022 and 2024. Each recording lasted on average 266 minutes, amounting to roughly 400 hours of multimodal data. Most patients (83%) were male, with a median age of 47 years and a median initial Glasgow Coma Scale score of eight. ICP was monitored with intraparenchymal sensors, arterial blood pressure from radial or femoral lines, and cerebral blood velocity via bilateral insonation of the middle cerebral arteries, all synchronised and captured at high sampling frequency using ICM+ software.
The signal processing pipeline was meticulous. After manual cleaning by experienced clinicians, automated filtering excluded non-physiological values and artefacts such as arterial line flushing or signal damping. Pulsatile cerebral blood volume was derived by beat-to-beat integration of blood velocity waveforms, and for each five-minute epoch the researchers generated an average ICP pulse waveform after ECG-synchronised pulse extraction. The identification of P1 and P2 peaks relied on recording-level heuristic rules drawn from waveform landmarks in the ICP, cerebral blood volume and arterial blood pressure signals, with expert visual quality control at every stage.
The headline result is striking in its clarity. Across segment-level, recording-level and patient-level analyses, PSI demonstrated a strong and consistent association with the P2/P1 ratio, with correlation coefficients of approximately 0.74 to 0.76 (all p < 0.001). The two indices followed an approximately linear relationship, and in mixed-effects models accounting for repeated measures within patients, PSI was significantly associated with P2/P1 (β = 0.36, P < 0.001). PSI alone explained 33.4% of the variance in P2/P1, a figure that rose to 88.6% once patient-level random intercepts were included, highlighting substantial inter-individual variability in how these waveform metrics behave across different brains.
Perhaps most compelling for clinical translation is PSI’s discriminatory power. Using empirical cut-offs of P2/P1 greater than 1.1 to define impaired compliance and less than 0.9 to define preserved compliance, the researchers evaluated classification performance with receiver operating characteristic (ROC) and precision–recall analyses. PSI achieved an area under the ROC curve of approximately 0.93 for detecting impaired compliance, with an AUC of 0.951 for identifying preserved compliance. Chi-squared threshold mapping across a grid of PSI and P2/P1 cut-offs identified two threshold pairs of maximal concordance: PSI 1.9 paired with P2/P1 0.9, and PSI 2.8 paired with P2/P1 1.2. These findings suggest that the empirical waveform categories clinicians have long used by eye map convincingly onto the physiologically validated ratio.
By contrast, other widely used indices fared poorly at the population level. The pressure–volume compensatory reserve index (RAP), which describes the moving correlation between mean ICP and pulse amplitude and is interpreted as a marker of where the intracranial system sits along its pressure–volume curve, showed only weak and inconsistent associations with P2/P1 (correlations ranging from −0.167 to 0.138), explaining less than 1% of variance. TCD-derived intracranial compliance (CI) and arterial compliance (CA), calculated as ratios of the fundamental harmonic amplitudes of cerebral blood volume to ICP and arterial blood pressure respectively, also contributed little incremental explanatory value on their own.
Yet the study’s most provocative finding emerged when the researchers looked beyond normalised waveform shape. Because both PSI and P2/P1 are derived from min–max normalised ICP pulses, they discard absolute amplitude information. When the researchers instead examined ICP pulse amplitude (AMP), the fundamental harmonic amplitude of the raw ICP signal, a distinct phenotype appeared: segments with low AMP (below 1.5 mm Hg) despite waveform features indicating impaired compliance (PSI above 3.0 and P2/P1 above 1.1). These 187 segments had significantly lower RAP values (median 0.59) than similarly impaired segments with higher amplitude (median 0.89), along with modestly lower cerebral perfusion pressure. The authors interpret this attenuated pulsatility not as the classic terminal pressure–volume behaviour seen at very high ICP, but as a state of reduced transmural vascular pressure, in which diminished arterial–venous pressure gradients limit vascular distensibility and dampen the pulsatile expansion of intracranial blood volume.
This interpretation carries real physiological weight, because it shows that reductions in RAP do not uniformly signal terminal pressure–volume exhaustion. In line with earlier work, segments with negative RAP in this dataset were actually associated with lower P2/P1 ratios and lower PSI values, suggesting relatively preserved waveform-derived compliance. Under a low-to-negative transmural pressure regime, vascular collapse may reduce intracranial blood volume and shift the system toward a more compliant portion of the pressure–volume curve, producing an apparent improvement in compliance even in the absence of marked intracranial hypertension. RAP, in other words, is context-dependent, and its meaning changes with the underlying vascular state.
The study also draws an important conceptual distinction that is often blurred in clinical discussion. Compliance metrics such as P2/P1, PSI and CI approximate the local slope of the intracranial pressure–volume curve, representing instantaneous distensibility at the operating point. RAP, by contrast, reflects compensatory reserve and indicates the position of the system’s working point along that curve. These are related but distinct constructs, and the weak correlation between CI and RAP observed here is exactly what theory would predict rather than a failure of either metric.
Methodologically, the analysis was careful about aggregation. Because repeated measurements within patients violate the assumptions of ordinary regression, the team used linear mixed-effects models with patient identity and recording number as random intercepts, alongside correlation analyses at three levels of aggregation. When AMP was added to the TCD-derived compliance indices, model performance improved substantially (R² of 0.154 for P2/P1 and 0.230 for PSI), and discriminatory performance for compliance state rose to an AUC of 0.799 for impaired and 0.762 for preserved compliance, supporting the case for multiparametric monitoring.
The limitations are acknowledged candidly. This was a single-centre study of traumatic brain injury patients only, and the substantial inter-individual variability observed across metrics may limit generalisability to other populations and pathologies. Treatment-level data such as the timing of osmotherapy were not available, and although waveform peaks were visually verified, misidentification of P1 and P2 remains possible in atypical or noisy morphologies. The P2/P1 ratio itself remains an indirect representation of pressure–volume behaviour; direct compliance assessment would require controlled volume perturbation, which is invasive and not feasible in routine care.
Even so, the clinical implications are considerable. PSI, implemented within platforms such as ICM+, offers an objective, standardised and real-time representation of ICP pulse morphology that could support less experienced clinicians and reduce inter-observer variability. Recent studies have already hinted at the versatility of waveform metrics, from predicting osmotherapy responsiveness in paediatric traumatic brain injury to detecting hypocapnia in hydrocephalus and assessing shunt function through dynamic waveform features. The Cambridge team argues that future frameworks should integrate waveform shape, absolute amplitude and reserve indices together, and that the observed paradoxical amplitude-reduction phase, along with applications in conditions such as hydrocephalus and subarachnoid haemorrhage, now demand prospective validation in larger, more diverse cohorts. For a measurement that has long lived in the eye of the beholder, intracranial compliance is finally acquiring the quantitative foundations it has always needed.
Subject of Research: Validation of waveform-derived metrics of intracranial compliance, comparing the pulse shape index with the P2/P1 ratio, RAP, pulse amplitude and TCD-derived compliance indices in traumatic brain injury patients
Subject of Research: Medicine
Article Title: Waveform-Derived Metrics of Intracranial Compliance: Validation and Pulsatile Dynamics
Article References: Olakorede, I., Bögli, S. Y., Czosnyka, M., & Smielewski, P. (2026). Waveform-Derived Metrics of Intracranial Compliance: Validation and Pulsatile Dynamics. Neurocritical Care. https://doi.org/10.1007/s12028-026-02620-1
Image Credits: AI Generated
DOI: 10.1007/s12028-026-02620-1
Keywords: intracranial compliance, intracranial pressure waveform, pulse shape index, P2/P1 ratio, RAP index, neuromonitoring, pressure–volume curve, traumatic brain injury, transcranial Doppler, cerebral perfusion pressure
Cite Scienmag News
APA
MLA
Chicago
Ophelia Keating. (September 10, 2026). Validating Waveform Metrics of Intracranial Compliance and Pulsatile Dynamics. Scienmag. https://scienmag.com/validating-waveform-metrics-of-intracranial-compliance-and-pulsatile-dynamics/
Ophelia Keating. “Validating Waveform Metrics of Intracranial Compliance and Pulsatile Dynamics.” Scienmag, 10 September 2026, https://scienmag.com/validating-waveform-metrics-of-intracranial-compliance-and-pulsatile-dynamics/. Accessed 10 September 2026.
Ophelia Keating. “Validating Waveform Metrics of Intracranial Compliance and Pulsatile Dynamics.” Scienmag. September 10, 2026. https://scienmag.com/validating-waveform-metrics-of-intracranial-compliance-and-pulsatile-dynamics/
Copy citation
Download RIS
Tags: Advances in neurocritical care monitoring toolsbrain injury secondary damage markersBrain physiology and intracranial pressure dynamicscontinuous intracranial compliance assessmentIntracranial compliance measurementIntracranial compliance measurement techniquesintracranial pressure dynamicsIntracranial pressure waveform shape and physiological interpretationintracranial volume regulationinvasive vs non-invasive ICP monitoringlimitations of waveform shape analysisLimitations of waveform shape analysis in intracranial monitoringMonro-Kellie doctrine and intracranial volume regulationNon-invasive assessment of intracranial compliancepulsatile ICP waveform analysisPulsatile intracranial pressure waveform analysisquantitative validation of ICP waveformsQuantitative validation of waveform metrics in neurocritical careRelationship between intracranial compliance and secondary brain injuryrole of pulsatile dynamics in neurocritical carewaveform metrics for brain physiologywaveform shape validation in neurocritical care