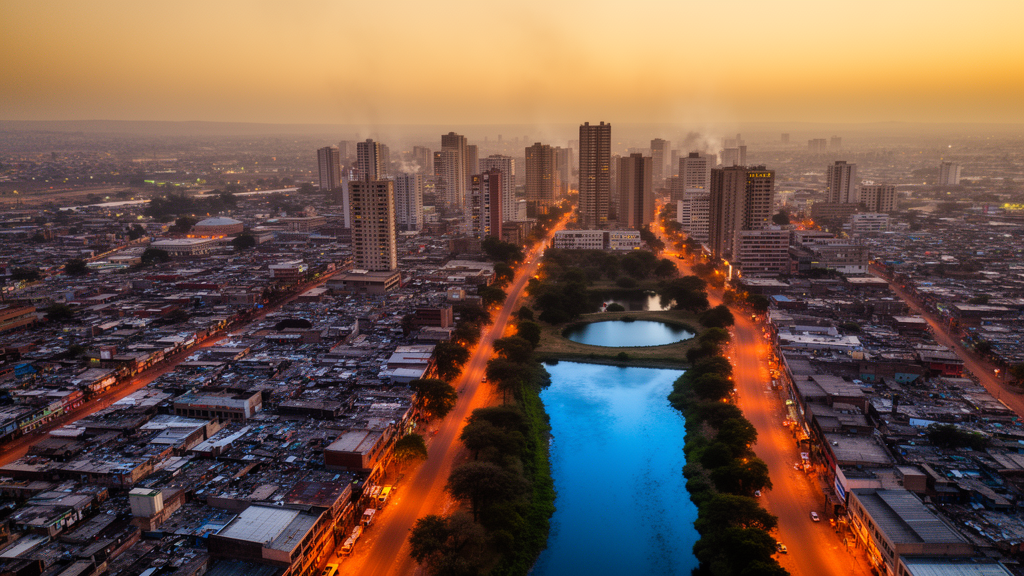
Gauteng Province, the smallest and most densely populated province in South Africa and the economic heart of the country, has been quietly heating up for four decades, and the consequences are now visible in its water. A new open-access study published in Computational Urban Science analysed satellite imagery from 1984 to 2024 to track how land system change driven by urbanisation has intensified urban heat islands and, in turn, altered surface water dynamics and moisture conditions across the province. Using Google Earth Engine, the researchers processed Landsat 5 TM imagery for 1984 through 2009 and Landsat 8 OLI/TIRS imagery for 2014 through 2024, all at 30 metre multispectral resolution, focusing on summer seasons at five-year intervals when heat stress and water scarcity are at their worst.
The team, led by Tamiranashe Kuwaza with Paidamwoyo Mhangara and Eskinder Gidey, derived land surface temperature from the thermal bands, computed the normalised difference vegetation index (NDVI) to quantify vegetation, and applied two water indices: the modified normalised difference water index (MNDWI), which enhances open water detection in urban settings, and the water ratio index (WRI), which captures water bodies, vegetation moisture, and shallow water. Daily precipitation and maximum air temperature came from NASA POWER reanalysis data, and heatwaves were defined as periods of at least three consecutive days exceeding the 90th percentile of the baseline period, a percentile-based approach chosen because no universally agreed heatwave definition exists.
The headline numbers are striking. Gauteng experienced a slight increase in land surface temperature over the study period, with high values rising from 62°C to 63.2°C, while low values fell dramatically from 24.8°C to 10.32°C. The mean high land surface temperature across the 40-year record was approximately 63.04°C, with a mean low of 11.31°C. The single highest reading, 66.5°C, and the lowest, 1.8°C, both occurred in 2004. Built-up areas averaged around 48.28°C, vegetation 46.72°C, and water bodies 44.70°C, confirming the contrasting thermal behaviour of impervious and natural surfaces. City centres registered a significant long-term increase of roughly 4.24°C, while the Vaal Dam warmed by about 0.11°C and the Bronkhorstspruit Dam actually cooled slightly, by an average of 0.5°C.
Perhaps the most consequential finding concerns the urban heat island intensity itself. In 1984, the average intensity for Gauteng was −2.18°C, meaning urban areas were on average cooler than their rural surroundings, a situation the authors attribute to historical land use patterns, lower development density, and larger vegetative cover within cities at the time. By 2024, that average had climbed to +0.25°C, and the maximum intensity reached 5.30°C. Johannesburg shifted from −2.46°C in 1984 to −0.26°C by the end of the record, a mean change of +2.2°C, while Tshwane and Ekurhuleni recorded mean changes of +2.21°C and +2.28°C respectively. The less densely urbanised Sedibeng and West Rand municipalities showed smaller increases, of +1.45°C and +1.13°C. Overall, the study concluded that urban heat island intensity increased between 1.79°C and 2.78°C across all major cities in the province.
Heatwaves tell a parallel story. Over the full 40 years, Gauteng experienced approximately 36 heatwave events with an average duration of about three days. But the frequency changed markedly: from 1984 to 2009 the average frequency was roughly one, whereas from 2014 to 2024 it rose to four. The average duration of heatwaves increased from around three to around six days, with the West Rand recording a high frequency of five events in 2024. Sedibeng experienced the fewest heatwaves, though the most extreme severity was observed there in 2024. The spatial footprint of the heat island followed built-up areas, with Tshwane, Ekurhuleni, and the City of Johannesburg showing consistently intensified signals, while peripheral zones with water bodies and vegetation registered negative, cooler values.
To understand what was driving these patterns, the researchers classified land use and land cover using a supervised Random Forest machine learning classifier trained on 1,528 digitised samples split 80/20 for training and validation. The classification achieved an overall accuracy of approximately 96%, with kappa coefficients above 0.9 and F-scores exceeding 86% for the built-up and water body classes. The resulting maps showed shrubland declining by 25% over the period, barren land by 5%, and built-up land by 2%, while forested land increased by 3%, grassland by 5%, cultivated land by 22%, and mines by 1%. Surface water extent grew by 145 km² and forestland by 649 km². Notably, the increase in vegetation detected by the NDVI was largely attributed to anthropogenic greening, protection of nature zones, and cultivated land expansion rather than natural ecosystem restoration, with irrigated suburban gardens and managed green spaces in wealthier suburbs contributing much of the signal.
The statistical core of the study lies in its Spearman correlation and Mann–Kendall trend analyses. The Mann–Kendall tests revealed statistically significant monotonic trends in precipitation (p = 1.03 × 10⁻⁸), maximum temperature (p = 2.87 × 10⁻¹¹), NDVI (p = 1.99 × 10⁻¹⁵), and the water ratio index (p = 1.11 × 10⁻⁹), with maximum temperature increasing and precipitation decreasing. Land surface temperature itself showed no significant trend over the 40 years, a result the authors link to temporal heterogeneity and the mixed land cover of the province, and the MNDWI likewise displayed no noticeable trend. Water scarcity was instead evidenced by the decreasing trend in the WRI at the provincial level, while strong blue-pixel water detections diminished after 1999.
The correlation matrix added nuance. NDVI was strongly negatively correlated with the WRI (ρ = −0.69, p < 0.001), the MNDWI and land surface temperature showed a moderately negative correlation (ρ = −0.40), and NDVI correlated negatively with land surface temperature (ρ = −0.26 in the Table 9 analysis). These relationships confirm the expected cooling roles of vegetation and water. But a sensitivity analysis uncovered a more troubling shift over time: the land surface temperature–WRI relationship transitioned from a weak negative to a strong positive correlation after approximately 2005, and the land surface temperature–MNDWI relationship, profoundly negative from 1984 to 2004, turned positive by 2011. In plain terms, the surface water bodies of Gauteng are getting warmer, and their cooling effect on their surroundings is weakening or disappearing.
This last finding may be the study’s most provocative contribution. While most urban heat mitigation strategies assume that adding blue infrastructure, ponds, dams, and water features, cools cities, the Gauteng data suggest that shallow, thermally stressed water bodies can themselves contribute to urban warming. The authors cite supporting work showing that urban water bodies can exert a warming effect on surrounding areas, and they caution that simply adding water features does not mitigate urban heat island intensity in densely built-up regions. Instead, they argue, surrounding vegetation buffers urban heat far more reliably, making green infrastructure expansion, adaptive vegetation management, water governance, and sustainable land use planning the policy priorities they highlight for rapidly growing provinces like Gauteng.
The study is candid about its limitations. Cloud contamination and missing pixels plague long-term Landsat thermal analyses, and thermal sensors cannot penetrate cloud cover, reducing spatial continuity in the datasets; the northern areas of Gauteng experienced such thermal contamination throughout the period. The NASA POWER climate data, at roughly 0.5° × 0.625° resolution, are coarser than municipal boundaries or Landsat imagery, requiring provincial aggregation. The authors also note that most water sources lie on the outskirts of the province, limiting fine-scale buffer analyses, and they recommend that future work integrate hydrothermal dynamics over sub-annual timeframes to improve location-specific planning. Even with those caveats, the four-decade picture is coherent: a province where urban expansion, declining precipitation, rising maximum temperatures, and increasingly heat-stressed surface water are converging, and where the cooling services of both vegetation and water can no longer be taken for granted.
Subject of Research: Remote sensing analysis of urban heat island effects on surface water and vegetation in Gauteng Province, South Africa, from 1984 to 2024
Article Title: Impacts of land system change− driven urban heat islands on surface water dynamics and moisture conditions in Gauteng Province, South Africa
Article References: Kuwaza, T., Mhangara, P., & Gidey, E. (2026). Impacts of land system change− driven urban heat islands on surface water dynamics and moisture conditions in Gauteng Province, South Africa. Computational Urban Science, 6(1), Article 54. https://doi.org/10.1007/s43762-026-00290-5
Image Credits: AI Generated
DOI: 10.1007/s43762-026-00290-5
Keywords: urban heat island, land surface temperature, Gauteng, remote sensing, Landsat, surface water, MNDWI, WRI, NDVI, heatwaves, Google Earth Engine, South Africa
News Source: Denise Maddox. (October 29, 2026). Urban Heat Islands Intensify Across Gauteng as Surface Water Comes Under Thermal Stress. Scienmag.