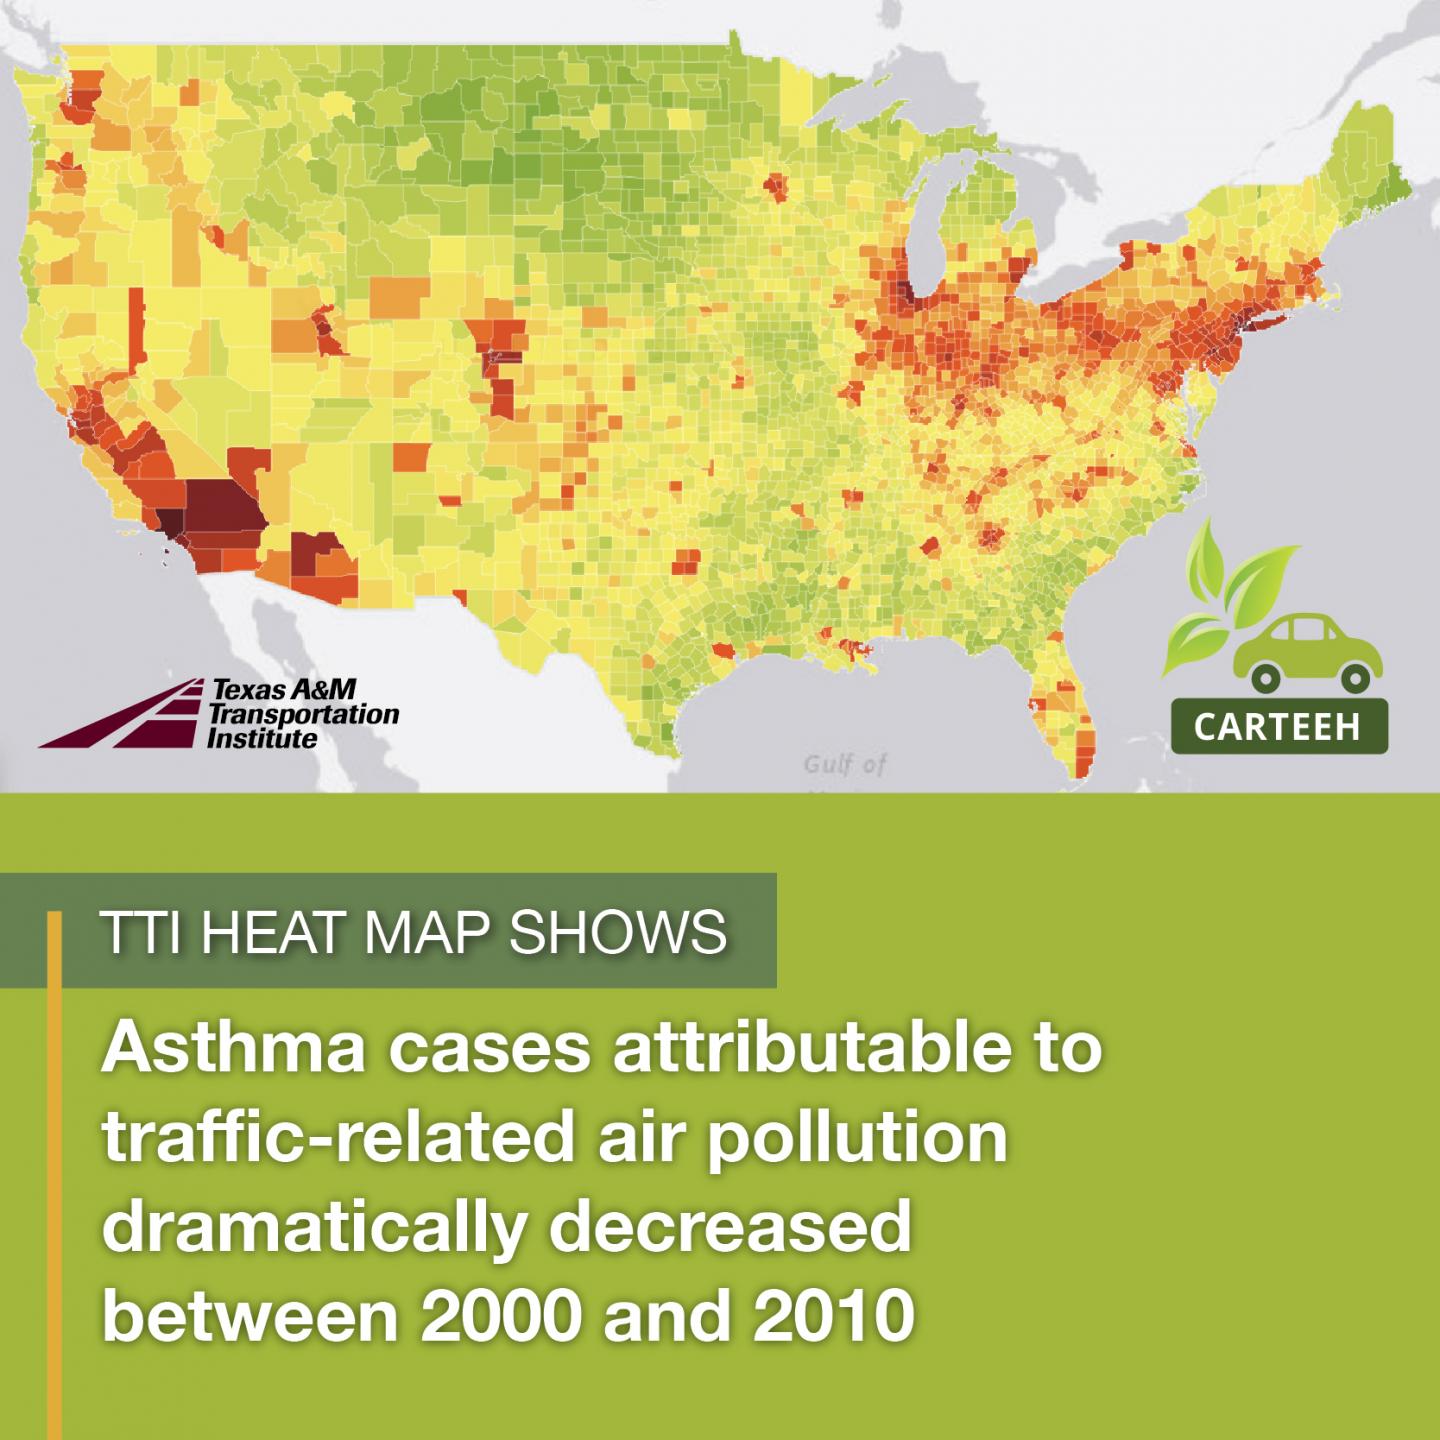
Asthma cases attributable to traffic-related air pollution dramatically decreased between 2000 and 2010
Credit: Texas A&M Transportation Institute
April 5, 2019 (College Station, TX) — A team of air quality and health researchers led by the Texas A&M Transportation Institute (TTI) have created a first-of-its-kind, county-by-county interactive heat map and city-by-city table detailing the distribution of childhood asthma due to traffic-related air pollution across the United States. One of the principal findings is that asthma cases attributable to traffic-related air pollution dramatically decreased over a 10-year period.
A research paper, “Traffic Related Air Pollution and the Burden of Childhood Asthma in the Contiguous United States in 2000 and 2010,” detailing the findings has been accepted for publication in the peer-reviewed journal Environment International.
“This is the first time a study has estimated the national childhood asthma incidents attributable to different ambient air pollutants,” states Principal Investigator Haneen Khreis, assistant research scientist with TTI’s Center for Advancing Research in Transportation Emissions, Energy and Health (CARTEEH). “Based on our modeling estimates, childhood asthma cases attributable to traffic-related air pollution (nitrogen dioxide, or NO2) decreased, on average, by 33 percent between 2000 and 2010. This is a win for public health.”
Khreis and her team created an interactive heat map showing the impact NO2 had on childhood asthma across the country during the years 2000 and 2010. Every U.S. county is represented, and users can hover over a county to see the findings for that county. Also, a table of the largest 498 cities across the country with detailed information for each year is presented. | Access the Heat Map and Table
For example, for Harris County (home to Houston, Texas), the map details the population of children in the county, the number and percentage of childhood asthma cases attributable to NO2, and the average NO2 concentration for the year. In 2000, there were 2,682 asthma cases attributable to traffic-related pollution, representing 25 percent of all asthma cases in the county. In 2010, there were four hundred fewer air pollution-related cases, representing 18 percent of all asthma cases in the county for that year and a 23.7 percent decrease from 2000. (In Texas, Houston and Dallas rank in the top 10 cities with traffic-related air pollution [TRAP] asthma cases.)
“The decline in NO2-related asthma cases is due to multiple factors, including more fuel-efficient vehicles,” says TTI’s Raed Alotaibi, a graduate assistant researcher and a medical doctor with CARTEEH. “Whatever the reason(s) for the decline, this is good news because asthma is one of the leading chronic airway diseases among children.”
TTI estimates there were more than 140,000 asthma cases due to TRAP in the United States in 2010. More than 80 percent of children with TRAP-induced asthma live in urban areas. Low income households are especially vulnerable.
The heat map can help better inform air quality policy makers, transportation agencies, medical associations and anyone else interested in learning more about the burden of childhood asthma due to air pollution. The research team is currently refining this analysis by using state-specific health data from surveys by the Centers for Disease Control and Prevention.
“This study highlights the issue of TRAP-related asthma and pinpoints those cities where air quality and asthma continue to be a major problem,” Khreis points out. “Despite the encouraging decrease in air pollution-related asthma cases, of those cases that remain, many could and should be prevented.”
###
About TTI
TTI develops solutions to the problems and challenges facing all modes of transportation. The Institute conducts over 700 research projects annually with over 200 sponsors at all levels of government and the private sector. Recognized as one of the premier higher education-affiliated transportation research agencies in world, TTI’s research and development program has resulted in significant breakthroughs across all facets of the transportation system. For more information, visit: tti.tamu.edu.
About CARTEEH
Funded by the U.S. Department of Transportation’s University Transportation Centers program, CARTEEH is a Tier-1 center focusing on the impact of transportation emissions on human health. TTI leads the CARTEEH consortium, which includes four partner universities: Johns Hopkins University, Georgia Institute of Technology, The University of Texas at El Paso, and the University of California, Riverside. For more information, visit: https:/
Media Contact
Haneen Khreis
[email protected]
Original Source
https:/
Related Journal Article
http://dx.


