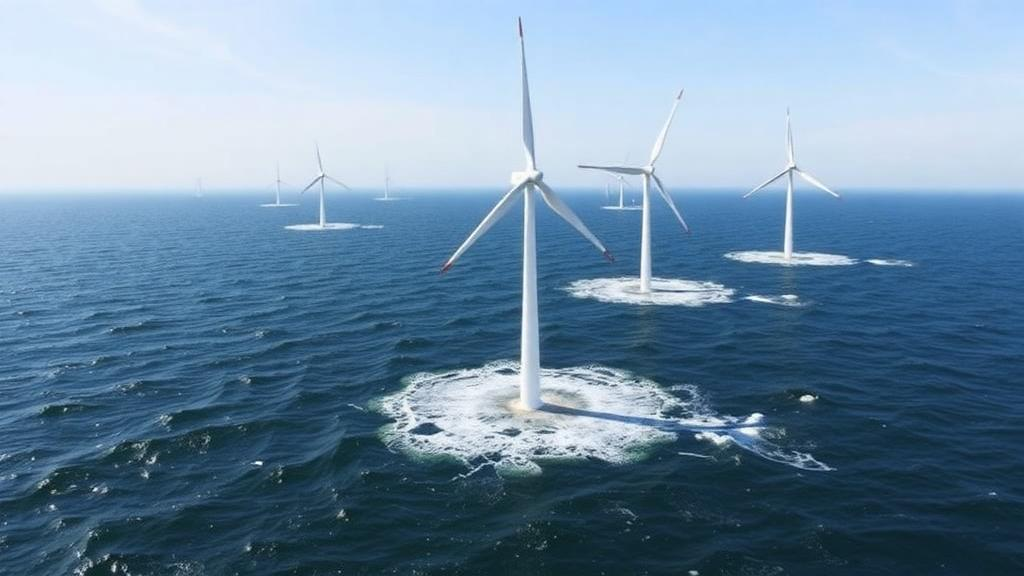
Offshore wind energy is expanding at a pace that few predicted a decade ago, and nowhere is that more visible than in the North Sea, where gigawatt-scale clusters of turbines now sit shoulder to shoulder in some of the windiest waters on Earth. But these giant installations cast long shadows in the atmosphere. Turbines extract momentum from the wind, leaving behind regions of slower, more turbulent air known as wakes, and when individual turbine wakes merge together they can form farm-scale deficits that stretch tens of kilometers downstream. A new study published in Wind Energy Science offers one of the most comprehensive long-term tests yet of whether numerical weather models can actually capture these effects in the real world.
The research, led by Alexandros Palatos-Plexidas of the von Karman Institute for Fluid Dynamics together with colleagues at the Vrije Universiteit Brussel, the Royal Meteorological Institute of Belgium, and partner institutions, focuses on the 3.7 gigawatt Belgian-Dutch offshore wind farm cluster in the Southern Bight of the North Sea. This dense collection of neighboring wind farms is the largest offshore cluster in operation today, which makes it a prime natural laboratory for studying how wind farms interact with each other and with the atmosphere above them. The team ran the Weather Research and Forecasting model, known as WRF, at a horizontal resolution of one kilometer for three full years, from 2021 through 2023, a configuration that is both unusually long and unusually fine for offshore wake research.
The technical heart of the study is the Fitch wind farm parameterization scheme, the most widely used method for representing wind turbines inside mesoscale weather models. Because a one-kilometer grid cell cannot resolve individual turbines, the scheme imposes a momentum sink on the mean flow within cells containing turbines, converting a fraction of the extracted kinetic energy into electricity and the remainder into turbulent kinetic energy. The researchers ran two otherwise identical simulations side by side within a single model run, one with the wind farms switched on and one without them, allowing the wake effect to be isolated as the normalized difference between the two wind speeds. The model was initialized and driven at its boundaries by ERA5 reanalysis data at 30-kilometer resolution, with three nested domains stepping down from 9 to 3 to 1 kilometer, and 80 vertical levels densely packed in the lowest few hundred meters of the atmosphere.
What sets this study apart is the observational benchmark. Four vertical profiling lidars, operated by different institutions, surround the cluster in a nearly perfect alignment along the prevailing southwesterly wind direction. The Westhinder lidar, installed on a survey platform roughly 40 kilometers southwest of the cluster, samples the incoming freestream flow. The Borssele B lidar, mounted on a TenneT grid platform inside the cluster, records what happens within the farms themselves. Two further lidars on the Europlatform and Lichteiland Goeree platforms to the northeast capture the far wake. Together they provide an unusually complete picture of upstream, intra-farm, and downstream conditions, all interpolated to a common reference hub height of 107 meters, typical of the turbines in the region.
The results show that switching on the wind farm parameterization substantially improves model accuracy where it matters most: inside and immediately downstream of the turbines. At the Borssele B location, under the dominant southwesterly flow, the wind farm simulation reduced the wind speed bias by about 82 percent compared with the no-farm run and by about 73 percent compared with raw ERA5 data. The Earth Mover’s Distance, a statistical measure of how well two distributions match, improved by roughly 74 percent and 65 percent respectively at the same site. Wind direction bias at Borssele B also dropped by about half when the turbines were represented. Across the wider domain, however, the picture is more nuanced: the Fitch scheme introduces an additional wind speed deficit downstream of the cluster, so the no-farm run can appear slightly more accurate at far-wake locations, a pattern consistent with earlier studies showing that the scheme tends to produce prolonged wakes.
Atmospheric stability emerged as a crucial controlling factor. Using the Obukhov length, a standard measure of whether buoyancy or wind shear dominates turbulence production in the boundary layer, the team classified conditions into seven categories and evaluated model performance in each. Very unstable conditions, in which buoyancy drives strong vertical mixing, prevailed over the three-year period, particularly in January and during late summer and autumn. The model performed best under near-neutral and moderately stable conditions, with correlation coefficients above 0.80, while accuracy degraded under the most extreme stratification, where correlation fell to between 0.69 and 0.77 and the root-mean-square error climbed. Notably, the wind farm simulation outperformed the no-farm run at the intra-cluster site across all stability regimes, even under the very stable conditions known to produce the longest and most persistent wakes.
The analysis also revealed striking directional asymmetries in wake behavior. Under southwesterly winds, the strongest wind speed deficit originates in the densely built Belgian wind farms, where turbine density averages 10 to 12 megawatts per square kilometer, and remains nearly unchanged as the flow crosses the more widely spaced Borssele zone, where density is only 4 to 5 megawatts per square kilometer. Under northeasterly winds the sequence reverses: the deficit builds gradually through Borssele and then intensifies sharply as the flow enters the dense Belgian cluster. At wind speeds above 11 meters per second, the maximum simulated deficit reached about 2.75 meters per second under southwesterly flow but about 4.06 meters per second under northeasterly flow. The study also documented blockage effects, the modest slowing of wind upstream of the farms, extending roughly 8 to 10 kilometers ahead of the front row under southwesterly conditions and about 5 kilometers under northeasterly flow, with the effect weakening as wind speeds increase.
To test the model against an entirely independent data source, the team compared simulated wake signatures with synthetic aperture radar images from the European Space Agency’s Sentinel-1 satellites. These radar instruments measure the roughness of the sea surface, which reflects centimeter-scale waves generated by the instantaneous wind stress, allowing wind speed at 10 meters height to be retrieved at 500-meter pixel resolution. For four carefully selected wake events, the wind farm simulation captured the larger-scale structure and extent of the wakes visible in the satellite images, including one case in which a prolonged wake extended more than 50 kilometers downstream under stable-neutral stratification. Quantitatively, the mean absolute error along transects through the cluster improved by 81 percent in the intra-farm region and 85 percent downstream compared with the no-farm simulation in the best-captured event.
The study is candid about its limitations. The model inherits a systematic negative wind speed bias from its ERA5 boundary conditions, which propagates into both simulations, and some of the apparent accuracy of the no-farm run likely reflects error cancellation with that biased input. The choice of the turbulent kinetic energy coefficient in the Fitch scheme remains debated; the team tested values of 0, 0.25, and 1 in a six-month sensitivity analysis and found that no single value consistently outperformed the others, settling on the WRF default of 0.25. The Obukhov length itself becomes uncertain under strongly stable conditions, when Monin-Obukhov similarity theory is known to break down. The authors suggest that future work should explore alternative parameterizations, such as the explicit wake parameterization scheme, and different boundary layer physics configurations.
For the offshore wind industry, the implications are significant. Wakes are the dominant driver of power losses in offshore wind farms, cutting energy extraction by 10 to 20 percent relative to lone-standing turbines, and as more clusters are built in each other’s vicinity, neighboring farms will increasingly sit inside each other’s wakes. Reliable multi-year simulations at kilometer scale, validated against real measurements, are essential for siting decisions, power forecasting, and estimating how future installations will affect existing ones. This three-year experiment demonstrates that a well-configured mesoscale model with a wind farm parameterization can do that job credibly, particularly within the waked regions themselves, while also mapping out precisely where the remaining uncertainties lie. As Europe races to multiply its offshore wind capacity, tools like this will help ensure that the next generation of wind farms is planned with a clear-eyed view of the atmosphere they must share.
Subject of Research: Long-term validation of mesoscale wind farm wake modeling in the North Sea using lidar and satellite radar observations
Article Title: Assessing the accuracy of a 3-year high-resolution mesoscale wind farm wake simulation with lidar and satellite radar data
Article References: Palatos-Plexidas, A., Gremmo, S., van Beeck, J., De Cruz, L., & Munters, W. (2026). Assessing the accuracy of a 3-year high-resolution mesoscale wind farm wake simulation with lidar and satellite radar data. Wind Energy Science, 11(9), 3555-3585. https://doi.org/10.5194/wes-11-3555-2026
Image Credits: AI Generated
Keywords: offshore wind energy, wind farm wakes, WRF model, Fitch parameterization, North Sea, lidar, synthetic aperture radar, atmospheric boundary layer, atmospheric stability, mesoscale modeling, wind speed deficit, Sentinel-1
News Source: Alan Morgan. (October 10, 2026). Three-Year Simulation Puts Giant North Sea Wind Farm Wakes to the Test. Scienmag.